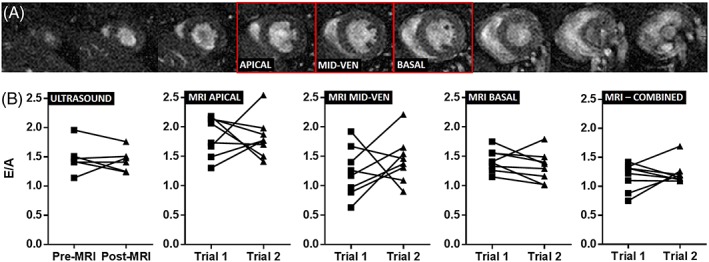
Figure 3.

(A) standard prospective cinematic (CINE) stack showing short‐axis images through a control mouse heart at diastole. Red boxes denote slices chosen for the determination of the most optimum slice in early‐filling to atrial/late‐filling ratio (E/A) measurements. (B) raw data from repeated measures of E/A in control mice using ultrasound and magnetic resonance imaging (MRI) at three different slice locations (apical, mid‐ventricle and basal) and when all three slices were combined (for all repeat measurements, p > 0.05, Wilcoxon signed‐rank test)
