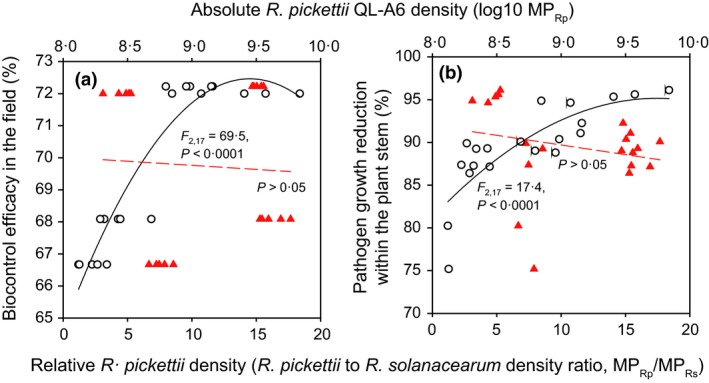
Figure 3.

The relationship between absolute (log 10 MPR p, red triangles) and relative Ralstonia pickettii densities (R. pickettii to pathogen density ratio, white circles, MPR p/MPR s) with biocontrol efficacy in the field (a) and pathogen growth reduction within the tomato stems (b). The black lines show a fit between relative and red dashed lines a fit with absolute R. pickettii densities. In (a) and (b), the MPR s and MPR p values were calculated independently for each crop season by using the audpc function in the R package {agricolae} and normalized with the total number of sampling time (days) to account for the differences between the crop seasons. [Colour figure can be viewed at wileyonlinelibrary.com]
