
Figure 1.
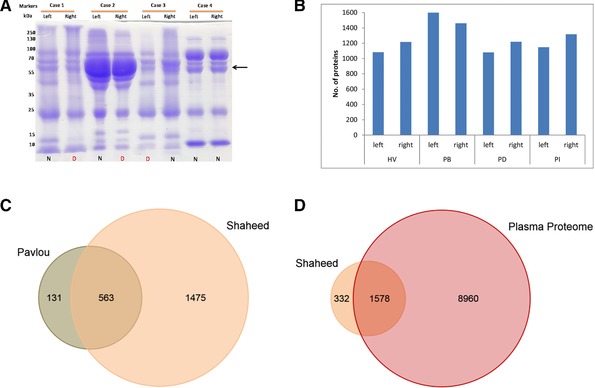
(A) SDS‐PAGE analysis of matched pairs of NAF samples from three IC patients (cases 1–3) and one HV (case 4). N, NAF samples from normal breast; D, NAF sample from diseased (benign, DCIS or IC) breast. Arrow indicates the position of serum albumin. (B) Number of identified protein (≥2 PSMs) by 2DLC MS analysis of eight NAF samples (four matched pairs, HV, PB, PD, PI). Venn diagrams illustrating (C). overlapping identities with the data from the NAF study by Pavlou et al 20, and D. overlapping identities with the Human Plasma Proteome database.