
Figure 2.
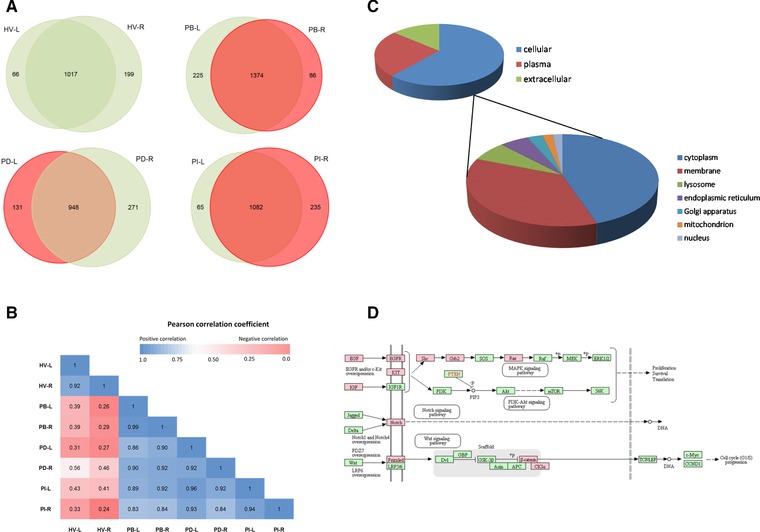
(A) Comparison of the matched NAF protein profiles. (B) Pearson correlation coefficient for each NAF profile compared to each other, based on median normalized log2 peak area for each protein. (C) Normal cellular localization of the 567 proteins common to all the NAF samples. (D) NAF proteins detected in breast cancer signaling pathways, highlighted in red with KEGG user data mapping function (http://www.genome.jp/kegg/)