
Figure 2.
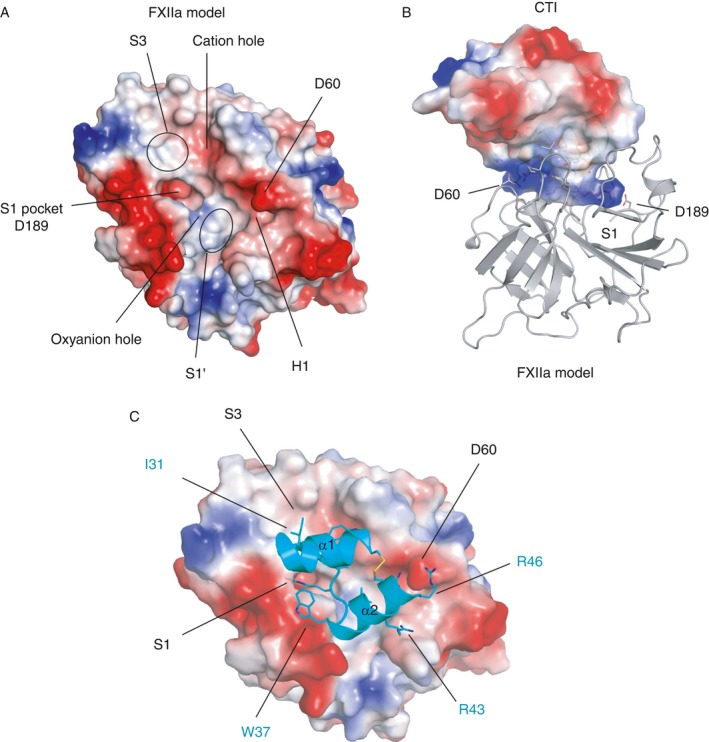
Charge surface representations of the activated factor XII (FXIIa)–corn trypsin inhibitor (CTI) interaction (blue = positive, red = negative). (A) The FXIIa model is shown with the key surface pockets labeled. (B) Docked complex of FXIIa (shown as a cartoon in gray) and CTI shown as a transparent charged surface illustrating the basic region interacting with the negatively charged S1 (D189) and H1 (D60) residues shown as sticks. (C) FXIIa protease as viewed in (A) but with CTI residues 20–44 shown as a cartoon in cyan, with key residues labeled as sticks in cyan.