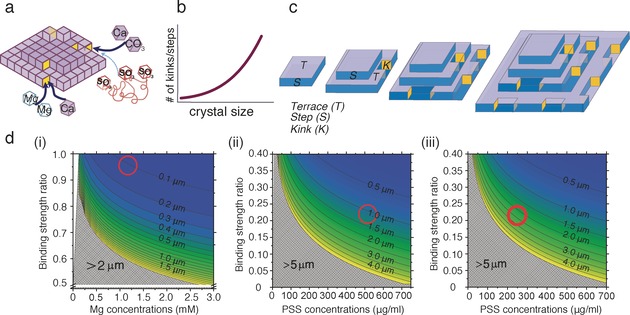
Figure 4.

Schematic summary of how additives affect calcite morphology. a) Mg2+ and PSS compete with the Ca2+ and CO3 2− growth units to bind to kink sites (yellow) at step edges. The thickness of the arrows indicates the relative binding strengths. b) The length of the step edges, and hence the number of kink sites, increases with the crystal size. c) For simplicity, only one {104} face is shown. Newly formed calcite crystals have few kink sites, and the probability of additive binding is low. As the crystals grow, an increase in the length of the step edges and the number of associated kink sites raises the probability of additive binding. Ultimately, the crystals are sufficiently large for additive binding to cause a change in the macroscopic crystal shape. d) “Transition sizes” at which morphological changes are predicted as a function of the additive/Ca2+ binding strength ratios at kink sites. The red circles show our experimental data for i) [Ca2+]=2.5 mm and [Mg2+]=1.25 mm, ii) [Ca2+]=2.5 mm and [PSS]=500 μg mL−1, and iii) [Ca2+]=1.25 mm and [PSS]=250 μg mL−1.
