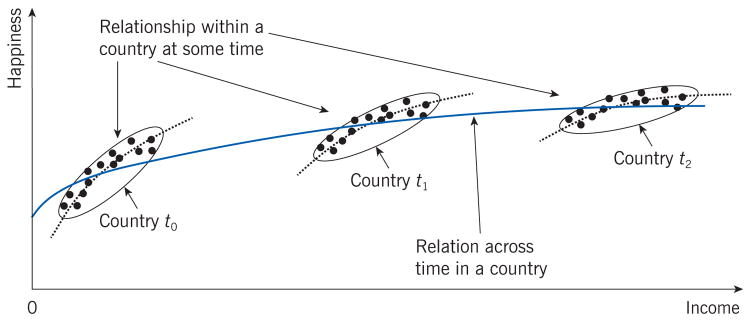
Figure 1. The Easterlin paradox.
Note: In all three periods (t0, t1, t2,), higher individual income is associated with higher individual happiness (the dotted lines), but aggregate happiness does not rise along with aggregate income from t0 to t2, (the solid line).
Source: Clark, A. E., P. Frijters, and M. Shields. “Relative income, happiness and utility: An explanation for the Easterlin paradox and other puzzles.” Journal of Economic Literature 46:1 (2008): 95–144 [4].

