
Figure 1. Typical positive ion mode spectrum of an unlabeled polar extract of PC9 cells after derivatization with ECF.
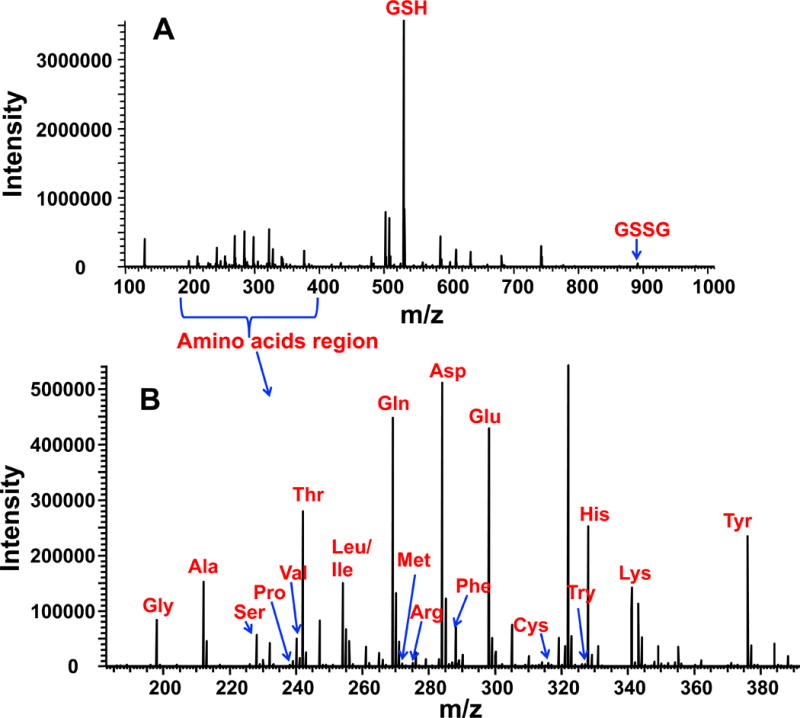
Panel A shows the full m/z range profile spectrum, which included the Na adducts of GSH and GSSG derivatives along with amino acid derivatives. Panel B shows the zoom-in profile spectrum in the amino acid range. The m/z peaks were assigned using “PREMISE” [13]. Most of the amino acids shown represented Na adduct species except for Arg and His, which were protonated species.