Figure 1.

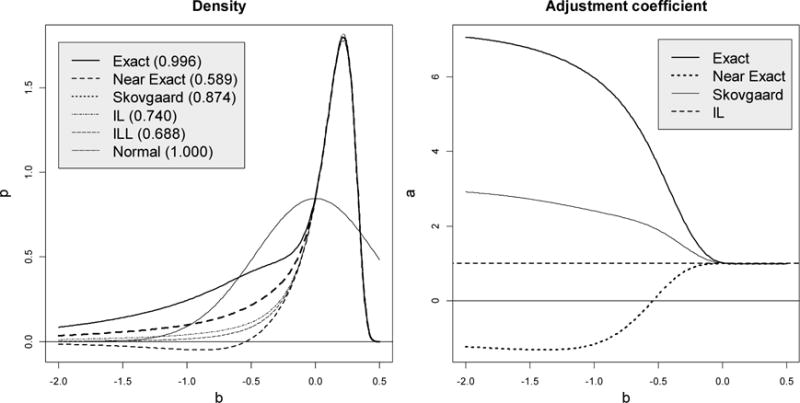
Exact and four density approximations for the exponential regression fi(β) = eiβ with i = 1, 2, …, 6, σ = 2.5 and the true β = 0. The figure in the parentheses shows the area under the curve (must be 1).

Exact and four density approximations for the exponential regression fi(β) = eiβ with i = 1, 2, …, 6, σ = 2.5 and the true β = 0. The figure in the parentheses shows the area under the curve (must be 1).