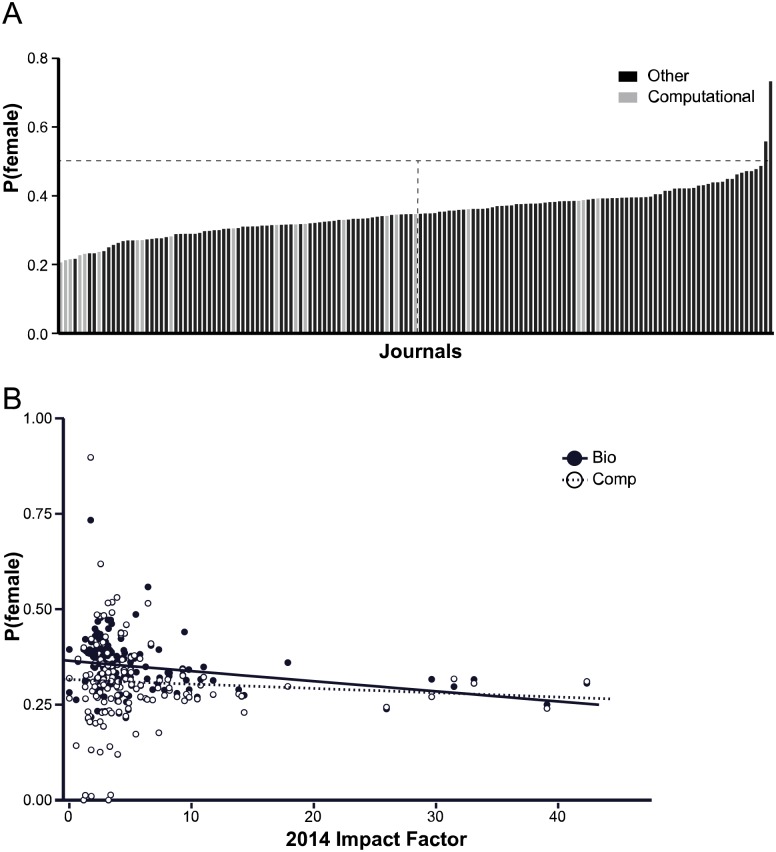
Fig 2.
A: Mean probability that an author is female for every journal that had at least 1000 authors in our dataset. Grey bars represent journals that have the words “Bioinformatics”, “Computational”, “Computer”, “System(s)”, or “omic(s)” in their title. Vertical line represents the median for female author representation. See also S1 Table. B: Mean probability that an author is female for articles in the “Bio” dataset (black dot) or in the “Comp” dataset (open dot) for each journal that had at least 1000 authors plotted against the journals' 2014 impact factor. Journals that had computational biology articles are included in both datasets. An ordinary least squares regression was performed for each dataset. Bio: m = −0.00264, PZ > |z| = 0.0022. Comp: m = −0.00079, PZ > |z| = 0.568.

