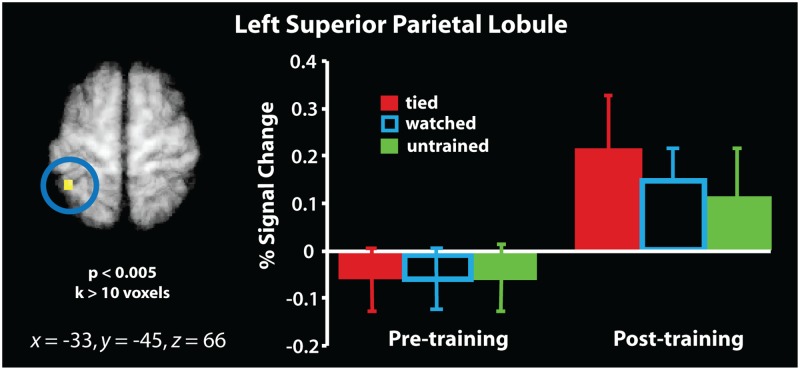
Fig 5. Interaction between physical training experience (learn to tie > untrained knots) and scanning session.
The t-map has been evaluated a threshold t > 2.88, puncorr. < 0.005, and is masked by the contrast illustrated in Fig 4 so that only those voxels that were part of the a priori established set of sensorimotor brain regions were interrogated. Parameter estimates were extracted from the resulting cluster from both pre-training and post-training scan sessions and are plotted to the right of the t-map for illustration purposes only. The outlined blue bars are included in the plot for completeness/illustration purposes only (i.e., the watched condition was not part of the contrast that is visualised on the brain image).

