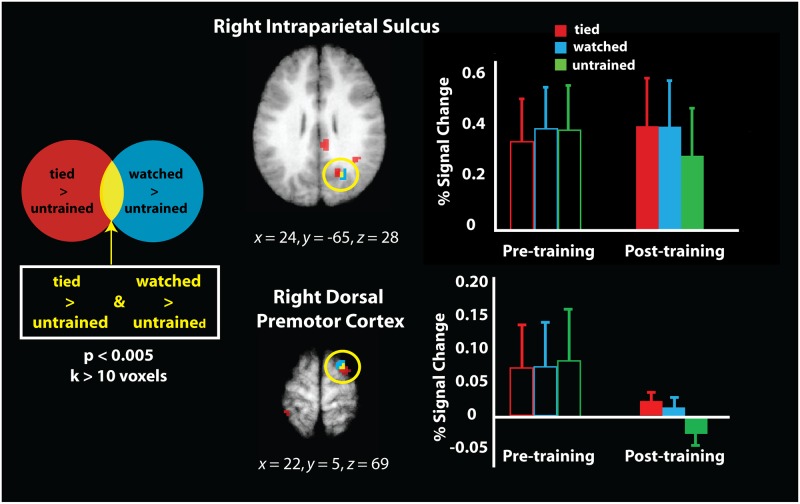
Fig 6. Direct comparison of the physical experience contrast (tied > untrained; in red) and the observational experience contrast (watched > untrained; in blue) from the post-training scan session, rendered on the same averaged brain image.
This conjunction analysis highlights the two brain regions that emerged (overlap between red and blue regions, visualised in yellow) where both the tied > untrained and watched > untrained contrasts reached the significance threshold of puncorr. < 0.005, masked by the sensorimotor brain regions illustrated in Fig 4. The plot illustrates the parameter estimates extracted from this region of the right IPS and right PMd. As this contrast was evaluated on the post-training scan session data only, and because all the knot categories were equally untrained/unfamiliar during the pre-training scan session, the percent signal change values from this same region during the pre-training scan session are visualised in outlined bars on the left side of the plot for illustration/comparison purposes only (i.e., these values were not part of the imaging contrast visualised to the left).

