
Fig 1. Box-and-whisker plots of shear wave elastography values for each Metavir stage.
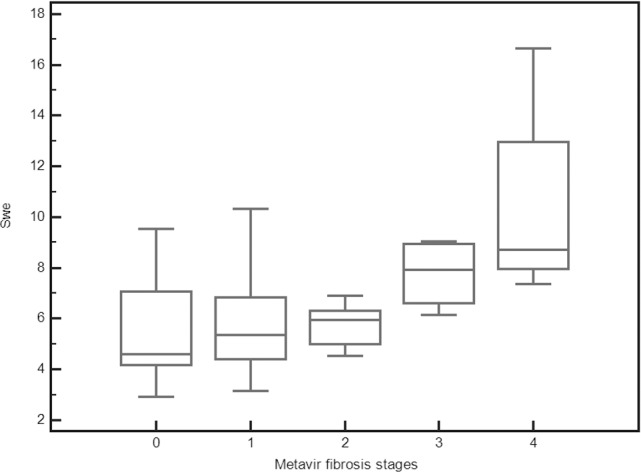
Liver stiffness values are reported on the y-axis, and Metavir grades are reported on the x-axis. The line through each box represents the median, and the central box represents values from the lower to upper quartiles (25th- 75th percentile). Error bars show minimum and maximum non-extreme values.