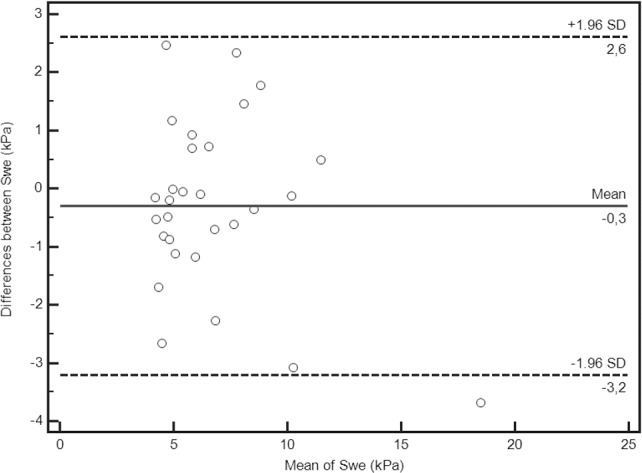
Fig 5. Bland-Altman analysis of the reproducibility of measurements.

Bias is represented by the solid line (–0.3). The two dotted lines represent the limits of agreement for reproducibility (–3.2; 2.6).

Bias is represented by the solid line (–0.3). The two dotted lines represent the limits of agreement for reproducibility (–3.2; 2.6).