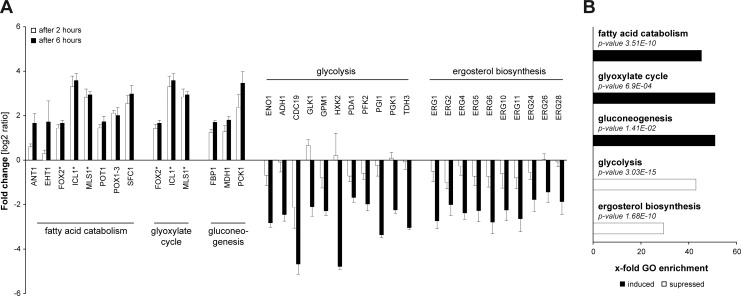
Fig 4. Regulation of C. albicans gene expression in response to LGG.
Monolayers of TR146 cells were preincubated with PBS or LGG for 12 h. Then, epithelial cells were infected for 6 h with C. albicans cells. For analysis of mRNA expression this experiment was performed three times. (A) Fold changes of mRNA expression in C. albicans in response to LGG. (B) Gene ontology enrichment of metabolic pathways in C. albicans in response to LGG. Corresponding sets of up- and down-regulated genes were mapped with the „GO term finder” at CGD to biological processes. X-fold enrichment is calculated as ratio of percentages of the cluster frequency of tested gene set and the cluster frequency of genomic background. * FOX2, ICL1 and MLS1 are associated with fatty acid catabolism and glyoxylate cycle. n = 3.

