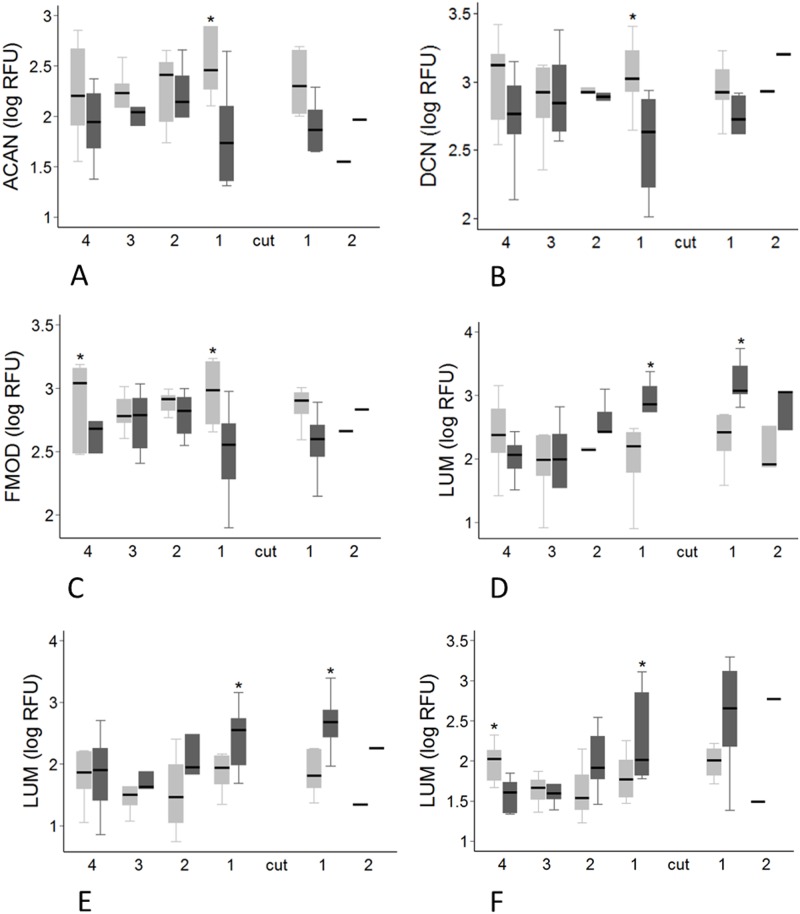
Fig 9. Regional variation in gene expression for proteoglycans.
Transected tendons are represented by the dark grey box and control tendons by the light grey box. Significant pairwise differences between transected and control tendons (P < 0.05, by paired t-test) are indicated by the asterisk. A: ACAN expression at 16 weeks post-transection. B: DCN expression at 16 weeks post-transection. C: FMOD expression at 16 weeks post-transection. D-F: LUM expression at 8 (D), 12 (E) and 16 weeks (F) post-transection.

