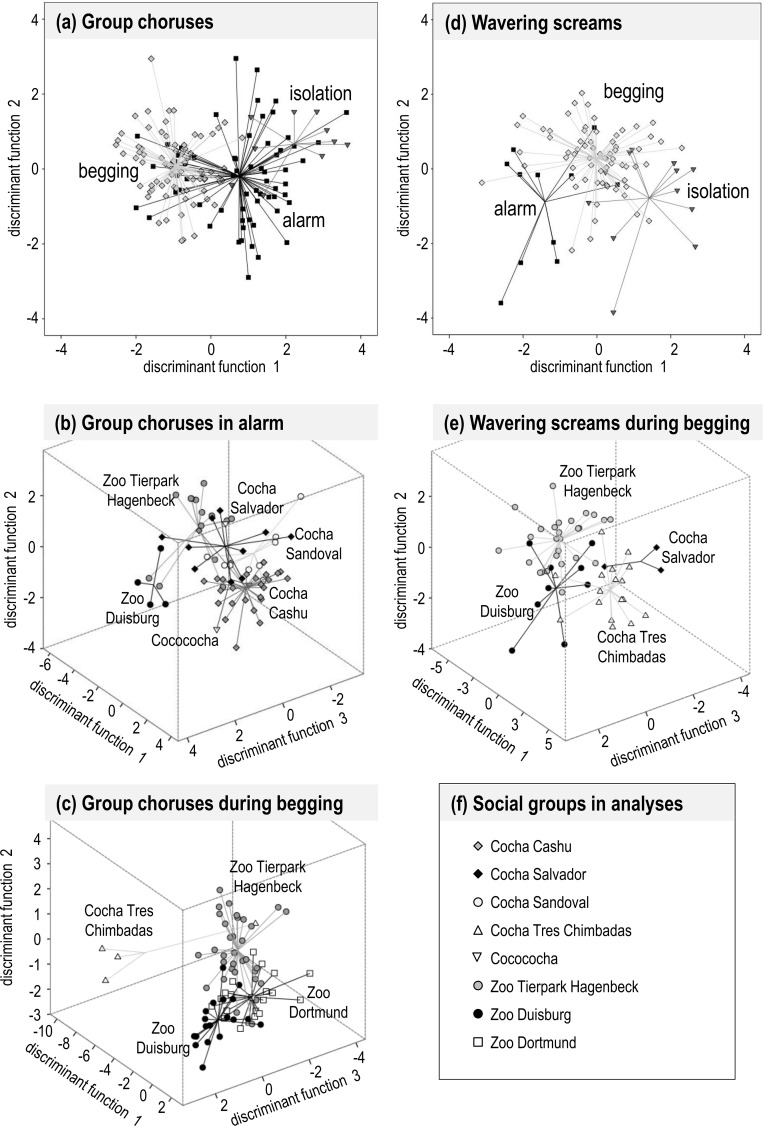
Fig 3.
Signal spaces depicting context-specific differences and group signatures for group choruses (a-c) and wavering screams (d-e). The signal spaces are defined by discriminant function analyses (on test data sets). Relative positions of vocalizations are marked with different symbols; lines depict the connection between vocalizations from the same behavioural context (a, d) or social group (b, c, e) to their respective centroids. Group chorus excerpts from three behavioral contexts (a), from six giant otter groups in alarm (b) and from four giant otter groups during begging (c) are shown. Wavering screams from three behavioral contexts (d) and from four giant otter groups during begging (e) are shown. Symbols of all social groups in analyses are listed in (f).

