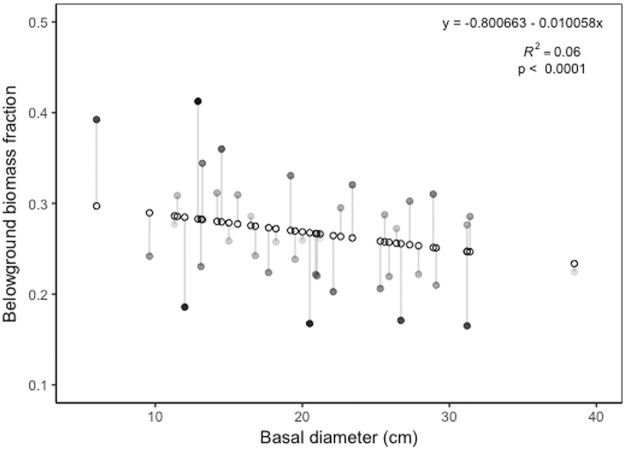
Fig 5. Basal diameter (BD) by % belowground biomass (%BGB).
The relationship between BD and %BGB for all six study species based on beta regression and likelihood ratio test (pseudo R2adj = 0.06, χ2 = 2.6036, p < 0.0001). Open circles represented modeled predicted values. Filled circles represent the residuals with darker circles being further from the predicted values than lighter, gray shaded circles.

