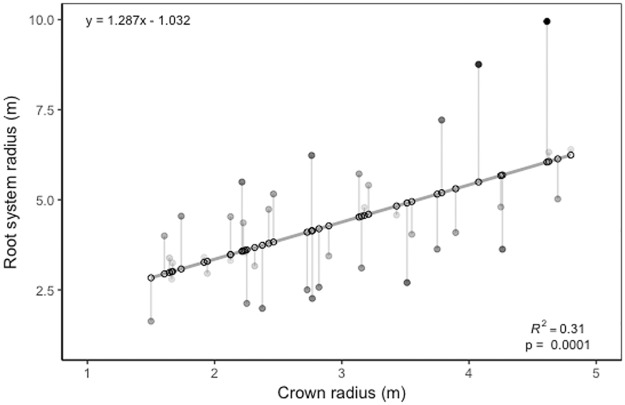
Fig 6. Crown radius (m) versus root system radius (m).
Crown radius (m) of 6 study species plotted against maximum rooting distance (m) of 6 study species. Significant relationship exists between crown radius and root system radius (R2 = 0.31 p < 0.0001). Open circles represented modeled predicted values. Filled circles represent the residuals with darker circles being further from the predicted values than lighter, gray shaded circles. Gray line represents the linear model.

