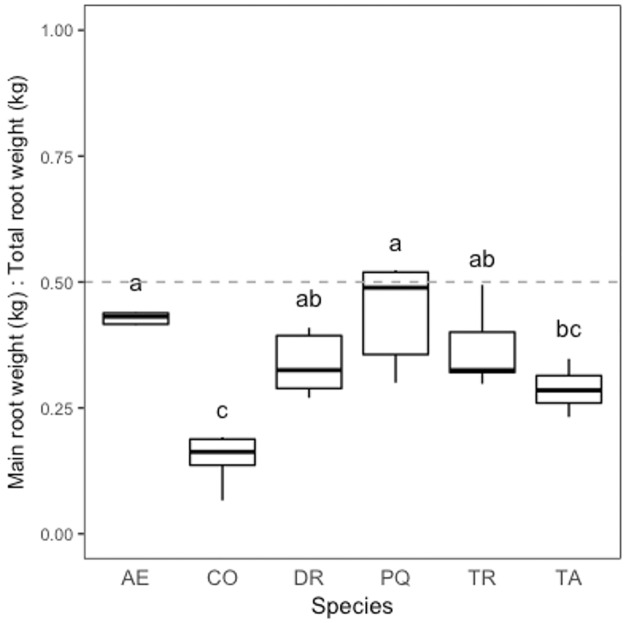
Fig 10. Main dry root weight to total dry root weight.
Boxplot parameters in the figure are as follows: the horizontal line within the box visualizes the median, boxes comprise data between the 1st and 3rd quartile of the data, whiskers reach to 1.5x interquartile range added to/subtracted from the 3rd/1st quartile. Axis letters signify the following: AE, A. excelsum, CO, C. odorata, DR, D. retusa, PQ, P. quinata, TR, T. rosea, TA, T. amazonia. Letters represent significant differences based on beta regression and likelihood ratio test.

