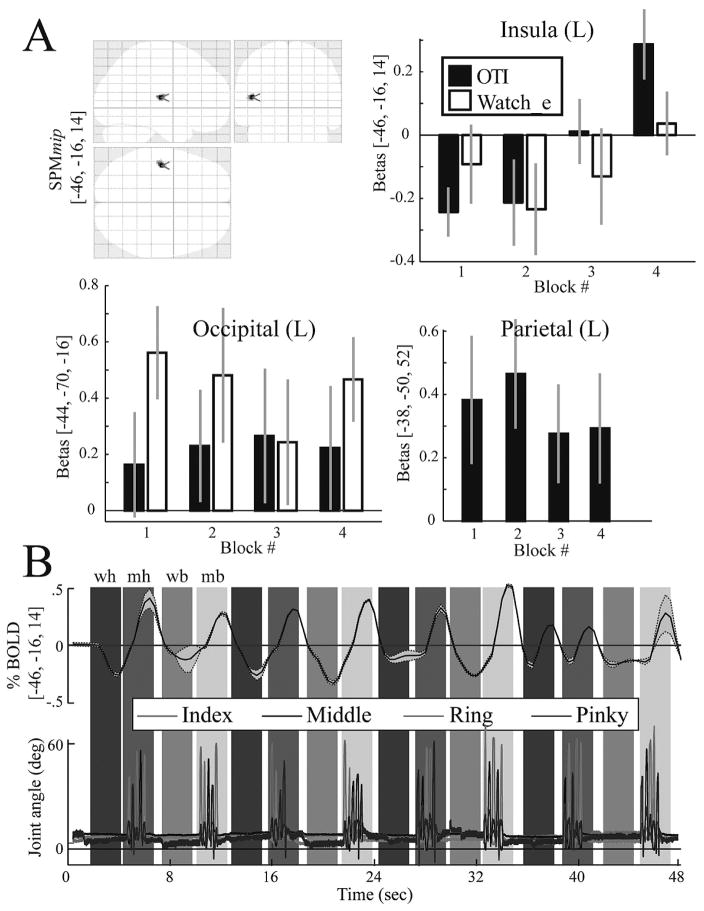
Fig. 4.
A. The top left panel shows on an SPM glass brain the only region, the insula, that showed a significant time-variant increase in activation during the OTI condition. The remaining three panels show bar plots of the beta values at three cortical locations: in the insula shown in the glass brain and two control sites that were recruited in the simple main effect contrast. Note that the time-variant increase is evident only in the insula and only in the OTI condition. The bar plots for the parietal site in the WATCH e condition are not shown since this site was not recruited in the simple main effect. B. The simultaneously recorded time-series data for the BOLD signal (top) (group mean ± 1SD) and the joint angles (bottom) (one representative subject) of the four fingers. Shaded vertical bars denote the condition epochs (wh, OTI; mh, MOVE h; we, WATCH e; me, MOVE e).

