
Fig 9. Correlation analysis of fold change data between qRT-PCR and RNA-seq.
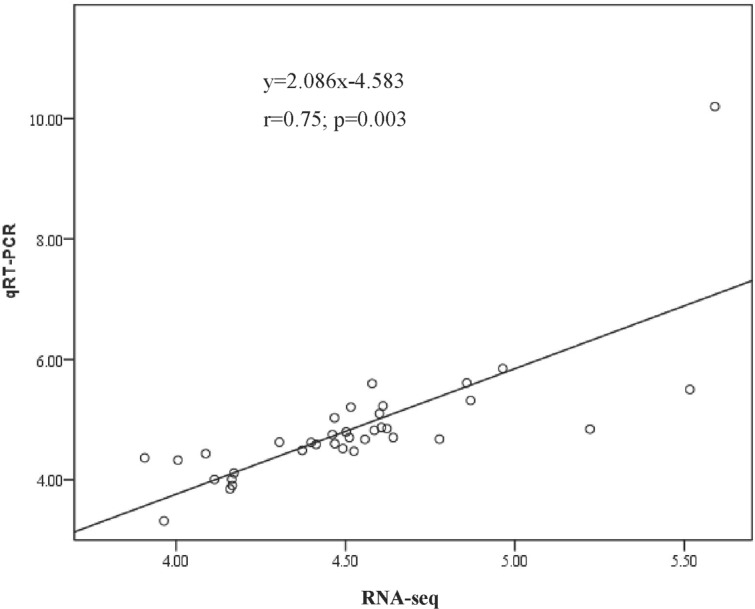
Data from qRT-PCR and RNA-seq are means of three replicates. Scatterplots were generated by the log2 expression ratios from RNA-seq (x-axis) and qRT-PCR (y-axis).
Official websites use .gov
A
.gov website belongs to an official
government organization in the United States.
Secure .gov websites use HTTPS
A lock (
) or https:// means you've safely
connected to the .gov website. Share sensitive
information only on official, secure websites.
Data from qRT-PCR and RNA-seq are means of three replicates. Scatterplots were generated by the log2 expression ratios from RNA-seq (x-axis) and qRT-PCR (y-axis).