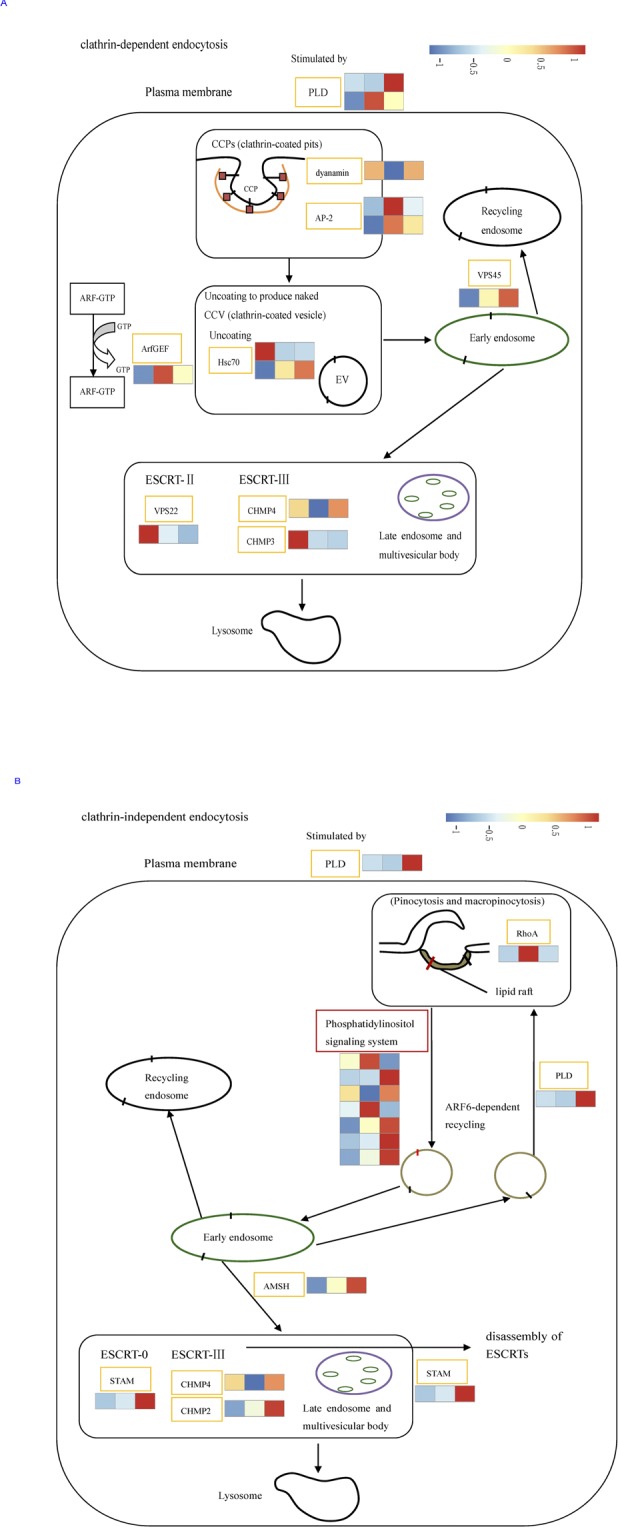
Fig 10. Differential expression genes involved in the pathway of endocytosis in I. cateniannulata.

A. DEGs involved in clathrin-dependent endocytosis (CDE); B. DEGs involved in clathrin-independent endocytosis (CIE). Columns in each heatmap from left to right represented the value of FPKM: HT, NT and LT. And each row represents a gene. Expression differences are shown in different colors. Red means high expression and blue means low expression.
