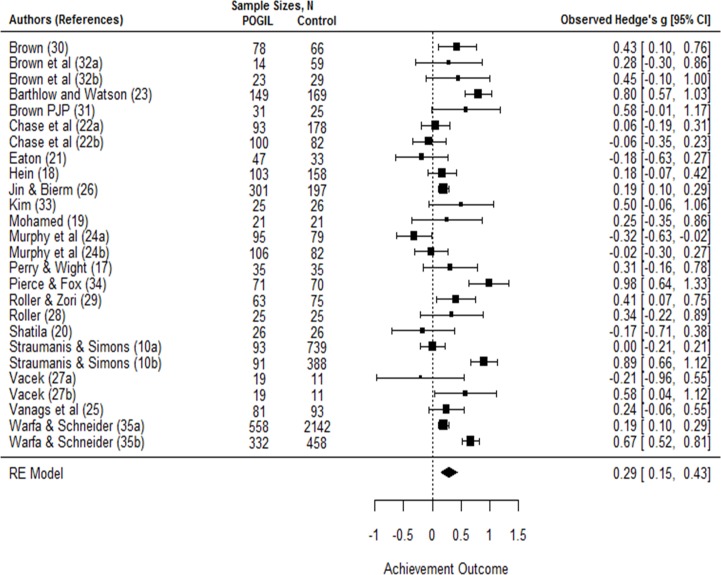
Fig 2. Effect sizes for achievement.
The forest plot shows the results of twenty-six experiments from 20 studies that contrasted POGIL pedagogy with control groups. The summary effect size of 0.29 [95% CI = 0.15–0.43] suggests student performance in the POGIL treatment is 0.3 standard deviations higher than that of the control group.

