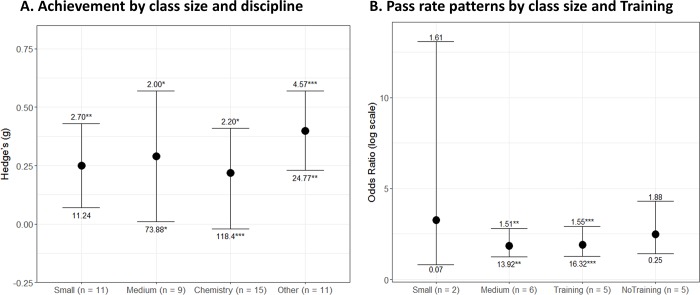
Fig 3. Meta-analysis by class size, disciplinary domains and instructor training.
Panels A and B show random-effects meta-analytic summaries [g or odds ratio plus 95% confidence intervals (CI)] for achievement outcomes (panel A) and course pass rates (panel B). Along with conventional significance levels (***p < 0.001, **p < 0.01, *p < 0.05, +p < 0.1), the numbers above the error bars show effect estimates divided by their standard errors (effect/SE) and the numbers below the error bars show the amount of heterogeneity in each dataset (Q). N refers to the number of studies meta-analyzed under each condition. See main text for degrees of freedom and further details of each factor.

