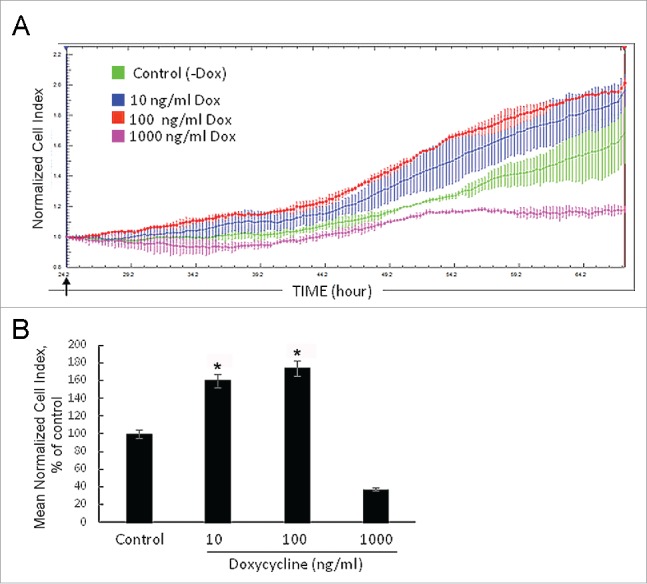
Figure 2.

Growth rate of NIH/3T3-174 fibroblasts monitored in real time with the xCELLigence (RTCA)-DP instrument system. (A) Cells (∼3,000/well) were seeded in duplicate in an E-16 plate and cultured in the absence (-Dox, control) or the presence of 10 ng/ml, 100 ng/ml and 1000 ng/ml (+Dox) doxycycline. Doxycycline in DMEM (+Dox) or the equal volume of DMEM alone (-Dox) were added after 24 hours of cell seeding (arrow). The horizontal axis – time in hours from the beginning of the experiment. The vertical axis – the normalized cell index automatically registered every 15 min. Small vertical bars in the curves are fluctuations of the index at each registration time-point occurred in duplicates. Doxycycline in the concentration of 1000 ng/ml (pink curve) represses cell growth, while 10 ng/ml (blue curve) and 100 ng/ml (red curve) doxycycline stimulate proliferation as compared with -Dox cells (green curve). The SURF6 pro-proliferative effects start to be visible after 5–6 hours of the induction (corresponds to ∼30 hrs on the horizontal axis) and intensify with time. (B) Bar graphs illustrating the mean normalized cell index in +Dox cells in the percentage to control (-Dox) values considered as 100%. The proliferation rate was determined by analyzing the slopes of each curve obtained between the doxycycline administration (at ∼24 hrs of post-seeding) and the end of an experiment (∼70 hrs of post-seeding; n = 3). The results are expressed as the mean ± SEM. (*) indicate the values which differ insignificantly (p > 0.05). Induction of SURF6 overexpression with 10 ng/ml and 100 ng/ml doxycycline significantly (p < 0.05) activates proliferation as compared with non-stimulated NIH/3T3-174 fibroblasts, whereas 1000 ng/ml doxycycline turns out to be cytotoxic for the cells.
