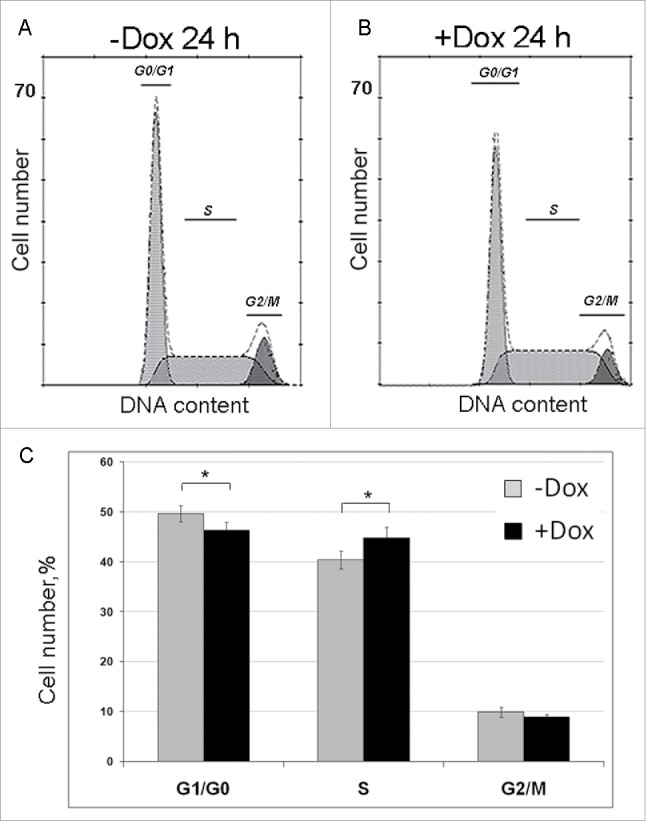
Figure 4.

Effects of SURF6 overexpression on cell cycle progression in NIH/3T3-174 fibroblasts as examined by flow cytometry after 24 hours of post-induction with 100 ng/ml doxycycline. (A and B) Results of a representative experiment, where cells were cultured without (-Dox, A) or with (+Dox, B) doxycycline. In the panel (C), bar graphs illustrate the mean percentage of +Dox (black columns) and -Dox (grey columns) cells which was calculated on the basis of four independent experiments. In G0/G1 phase the number of +Dox cells (46.2 ± 2.0%) is significantly lower (p < 0.05) that the number of -Dox cells (49.6 ± 1.9%), while in S phase the number of +Dox cells (44.9 ± 2.6%) significantly (p < 0.05) exceeds that of -Dox cells (40.5 ± 2.0%). The numbers of +Dox and –Dox cells at G2/mitosis are rather similar. Data are presented as the mean ± SEM.
