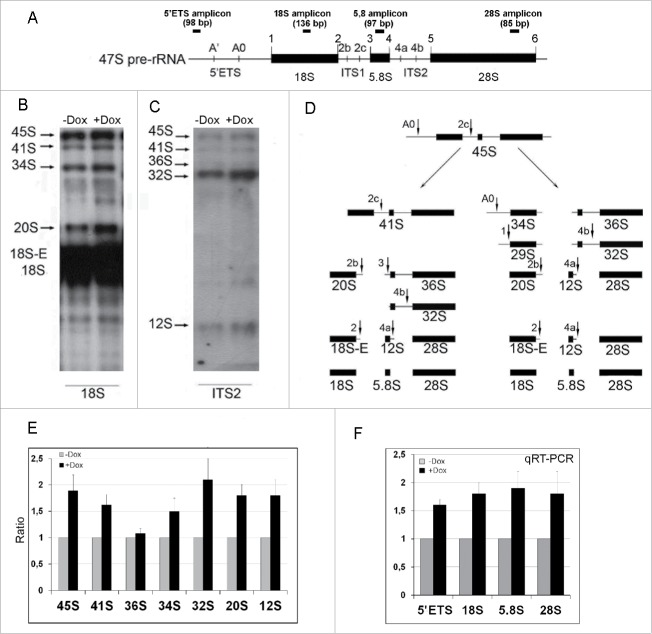
Figure 5.
The diagram of the primary 47S pre-rRNA in the mouse (A), Northern blot (B, C, and E) and qRT-PCR (F) analysis of rRNA expression in NIH/3T3-174 fibroblasts cultured without (-Dox) or with (+Dox) 100 ng/ml doxycycline for 24 hours. (A) 5′ETS, the 5′ external transcribed spacer; ITS1 and ITS2, the internal transcribed spacers 1 and 2 correspondingly; 18S, 5.8S and 28S are 18S, 5.8S and 28S rRNAs correspondingly. Small vertical bars and designations above the schemes indicate positions of the known pre-rRNA cleavage sites. Small horizontal bars above the schemes indicate positions of the PCR amplicons for 5′ETS and 18 S, 5.8 S, 28 S rRNA (according to ref. 1). (B and C) RNA was isolated from sub-confluent fibroblasts and hybridized with [P32] labeled probes recognizing the 18S rRNA (B) or ITS2 (C) regions of the 47S pre-rRNA transcript (A). Arrows indicate positions of the main rRNA species. (D) In mouse cells, processing of the 45S pre-rRNA proceeds mainly through two alternative pathways. In pathway 1, the pre-rRNA processing is initiated in the 5′-ETS to yield 41S pre-rRNA, while in pathway 2, the first cleavage occurs in ITS1 at site 2c to yield 34S rRNA (the longest precursor for 18S rRNA) and 36S rRNA (the longest precursor for 28S rRNA). The 41S pre-rRNA is further cleaved at site 2c into 20S and 36S rRNAs, which are then processed to 18S and 28S rRNAs correspondingly. (according to 1). (E) Bar graphs illustrating intensities of rRNA hybridization signals in +Dox cells (black columns) normalized to the values in -Dox cells (grey columns). Data in +Dox cells are presented as the mean ± SEM based on quantification of the results of four Northern blots. (F) Bar graphs illustrates the amount of the 47S pre-rRNA (the 5′ETS amplicons), 18S, 5.8S and 28S rRNAs in +Dox cells (black columns) normalized to the values in -Dox cells (grey columns). The values obtained in +Dox cells are presented as the mean N ± SEM based on the results of five independent experiments.

