
Figure 7.
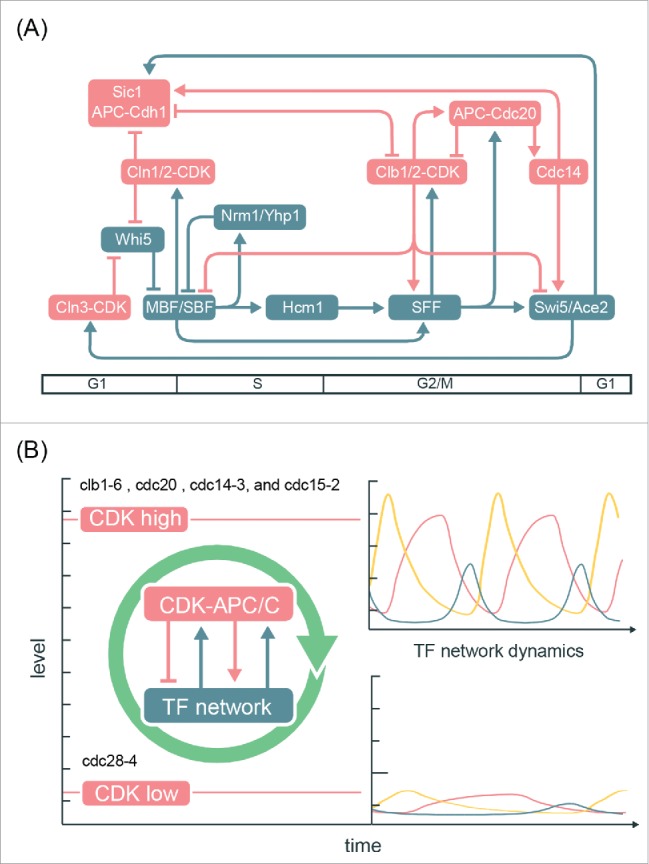
Integrated network model for the control of the cell-cycle transcriptional program in budding yeast. (A) Network diagram incorporating components of the CDK-APC/C model proposed by Rahi et al.33 and the TF network model proposed by Orlando et al.27 Nodes are ordered horizontally by their approximate time of activation during the cell cycle. See Table S3 for edge evidence. (B) Functional outcomes of the cell-cycle-transcriptional program during different CDK-APC/C perturbations with either high or low CDK activities.