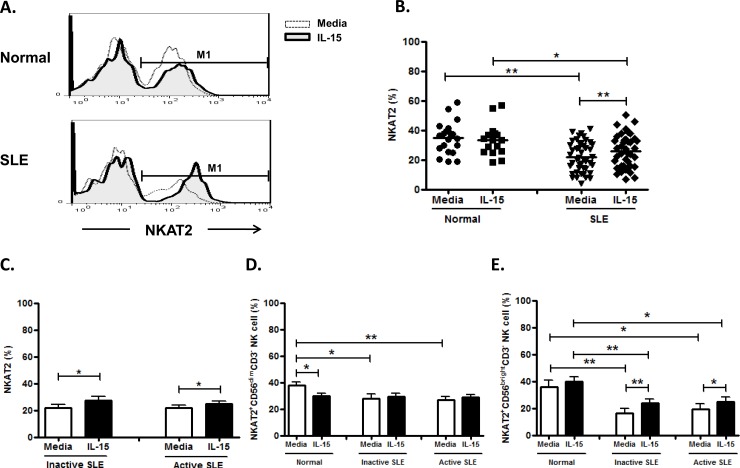
Fig 9. Effect of interleukin(IL)-15 on NKAT2 expression of CD56+CD3- NK cells from SLE and healthy control.
A. Representative histograms of SLE patients (SLE) and controls(Normal) B.Comparison between SLE patients as a whole and controls (Normal) using scattergrams (transverse lines indicate means); C. Comparison between SLE patients with active disease and inactive disease; D. Comparison of NKAT2 expression on CD56dim NK subsets in SLE patients with different severity as well as normal controls; E. Comparison of NKAT2 expression on CD56bright NK subsets in SLE patients with different severity as well as normal controls. PBMC were stimulated with or without IL-15 (10ng/ml) for 18hrs. For C,D,E, data was expressed as mean percent expression (%) ± S.E.M. (Normal, n = 19; SLE, total n = 46, SLE with active disease, n = 27, SLE with inactive disease, n = 18) * p<0.05, ** p<0.01. The Wilcoxon signed rank test was applied for analysis of the difference of responses before and after IL-15 treatment. SLE patient and healthy control data were compared between groups using the Mann–Whitney U-test. (calculated by SPSS 17.0 software).

