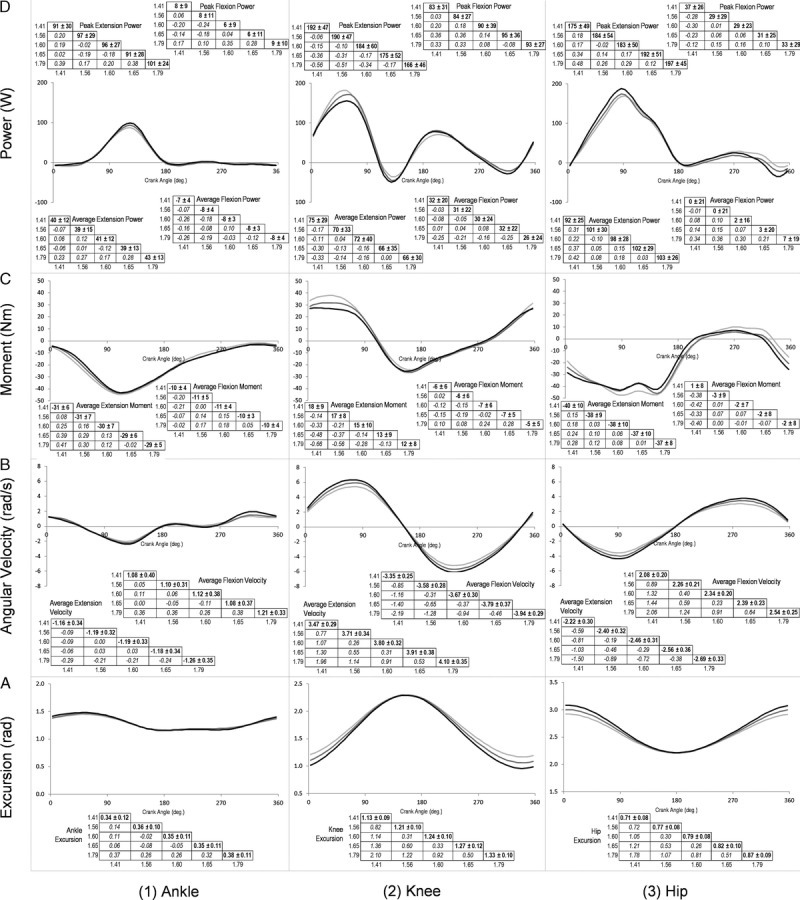
FIGURE 1.

Changes in joint kinetics and joint kinematics across pedal speeds. Joint profiles and associated descriptive statistical data tables and are presented for the ankle (1), knee (2), and hip (3) to show the effect of pedal speed on excursion (A), angular velocity (B), moment (C), and power (D). Statistical data tables display mean and standard deviations in bold, with effect sizes for the pairwise comparisons in the remaining cells. For clarity, joint profiles are only presented for the slowest (light gray), middle (gray), and fastest (black) pedal speeds.
