
FIGURE 2.
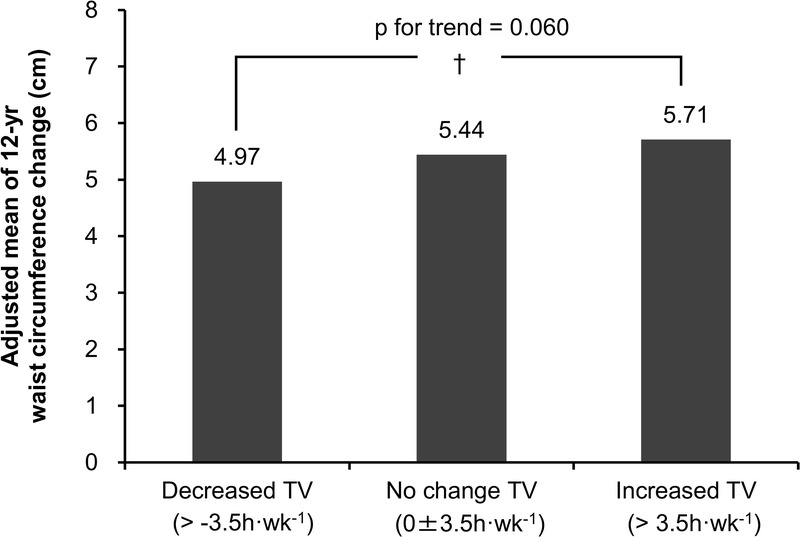
Associations of categories of 5-yr TV viewing time change with waist circumference change Analysis adjusted for baseline waist circumference; baseline TV viewing time; gender, age, education, employment status, income, antihypertensive medication, lipid-lowering medication, alcohol consumption, total energy intake, physical functioning at baseline; and for baseline and 5-yr change in MVPA (model D). Data are adjusted means. †P < 0.1.