
FIGURE 3.
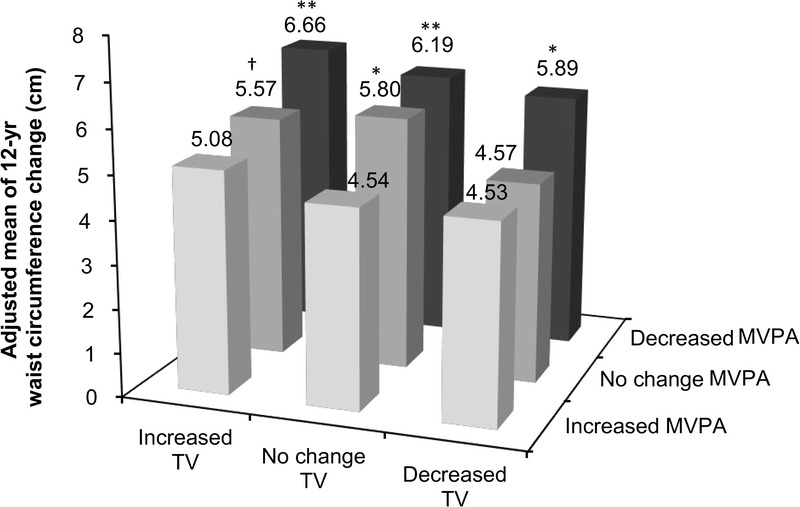
Associations of joint categories of MVPA and TV viewing time changes with waist circumference change. Analysis adjusted for baseline waist circumference; baseline MVPA and TV viewing time; gender, age, education, employment status, income, antihypertensive medication, lipid-lowering medication, alcohol consumption, total energy intake and physical functioning at baseline. Data are adjusted means. Significant differences from the reference category (increased MVPA and decreased TV viewing time) are shown. †P < 0.1, *P < 0.05, **P < 0.01.