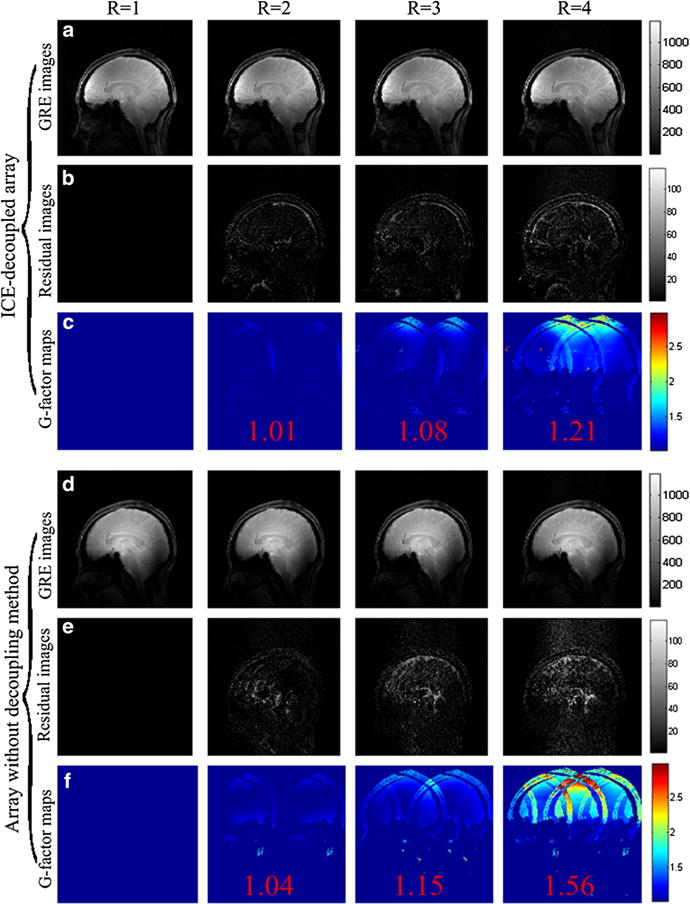
Fig. 6.

GRE images, residual images, and g-factors maps of the ICE-decoupled monopole array (a–c) and the monopole array without decoupling methods (e–f) with the acceleration factor R of 1 (no acceleration), 2, 3 and 4 in the sagittal plane. Average g-factors are marked in red color in the g-factor maps (Fig. 6c and f). The average g-factors of the ICE-decoupled monopole array with R of 2, 3 and 4 were 1.01, 1.08, and 1.21, respectively, whereas the average g-factors of the monopole array without decoupling methods with R of 2, 3 and 4 were 1.04, 1.15, 1.56, respectively. The maximum g-factors of the ICE-decoupled monopole array at R = 2, 3 and 4 were 1.35, 1.96, and 2.68, respectively, whereas the average g-factors of the monopole array without decoupling methods at R = 2, 3 and 4 were 1.43, 2.53, and 5.02, respectively. These results demonstrates that the parallel imaging capability of 8-channel monopole array was highly improved by using the ICE decoupling method
