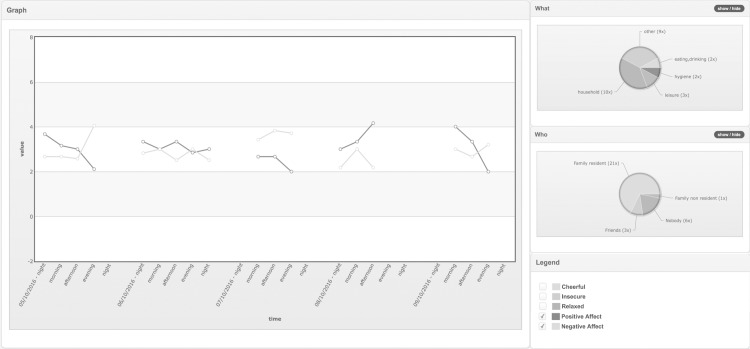
Fig 3. This figure is an example of the PsyMate™ ESM feedback, provided on a dedicated website with choice of ‘contextual’ or ‘functional’ analysis.
The data (here five consecutive days) are displayed over time (here clustered in dayparts; morning, afternoon …). Aggregated Likert scores of the scale items (here positive- and negative affect is selected) reflect the mental state at the time points. What and Who pie charts display the time budgets for the sampling period. In an interactive feedback meeting with the patient, the clinician can select options of the pie chart to break down the subject’s responses and assess whether mental states are contextualized (subject feels better in one situation, compared to the other) or zoom in on specific moments, that reflect vulnerability (crisis) or resilience (coping).

