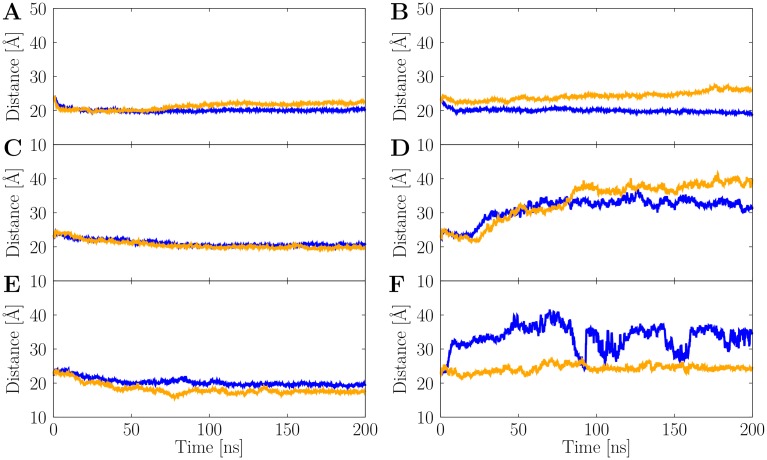
Fig 4. Stability of the central water pore.
The average Met35-Met35 distance between Aβ chains within the same layer is shown as function of the simulation time for both full-length (left panels) and truncated (right panels) Aβ species. (A) AL3x∞. (B) AT3x∞. (C) AL3x12. (D) AT3x12. (E) AL3x6. (F) AT3x6. The two MD runs are shown in blue and orange, respectively.

