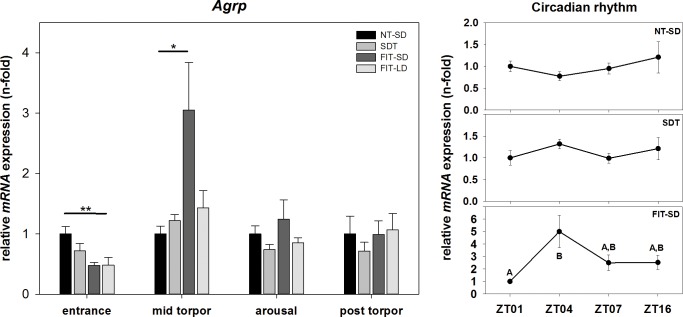
Fig 3. Relative mRNA expression of Agrp.
Bar graphs (with n = 5 for each bar) show fold changes of mRNA expression for hamsters undergoing SDT (mid grey bars, ±SEM), FIT-SD (dark grey bars, ±SEM) and FIT-LD (light grey bars, ±SEM) relative to NT-SD (black bars, ±SEM) for torpor entrance (ZT1), mid torpor (ZT4), arousal (ZT7) and post torpor (ZT16) respectively. Significant differences within each torpor state are marked with * = p<0.05, ** = p<0.01 and *** = p<0.001. Line graphs show differences in mRNA expression (±SEM) at four different time points (with n = 5 for each time point) over the course of a day relative to ZT1 for hamsters remaining active (NT-SD), undergoing SDT or FIT-SD. Significant differences are marked with different upper cases (p<0.05).

