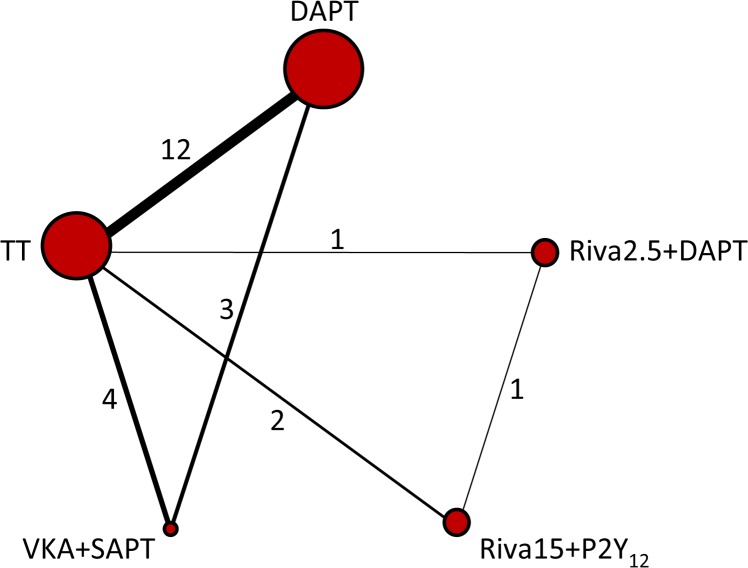
Fig 2. Network diagram of treatment comparisons for MACCEs and major bleeding of competitive antithrombotic regimens.
MACCEs, main adverse cardiac and cerebrovascular events; DAPT, dual-antiplatelet therapy; TT, triple-antiplatelet therapy; VKA, vitamin K antagonist; SAPT, single antiplatelet therapy; Riva15 + P2Y12, rivaroxaban 15 mg/d plus P2Y12 inhibitor; Riva2.5 + P2Y12, rivaroxaban 2.5 mg bid plus P2Y12 inhibitor. The size of each node is proportional to the overall sample size of the corresponding therapy. Each line represents the direct comparison between two treatments, and the corresponding width is proportional to the number of trials. Number next to the line indicates the specific number of studies.

