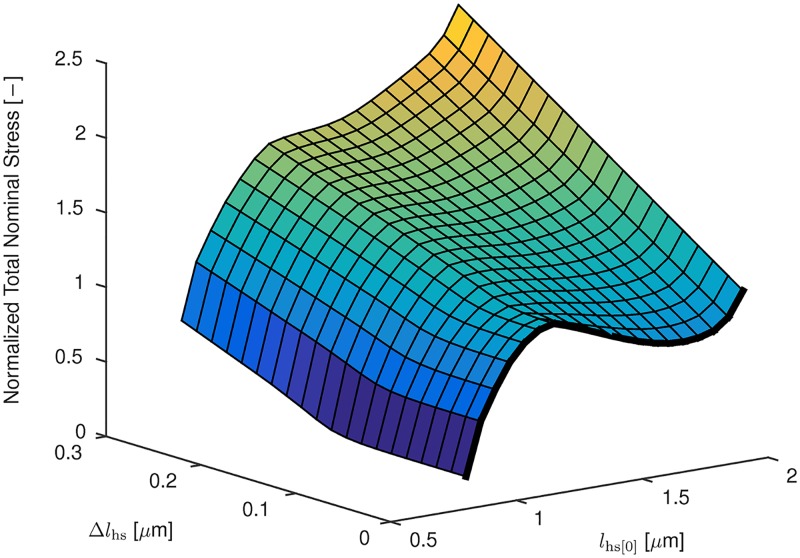
Fig 5. Total stress of the half-sarcomere model with actin—titin interaction versus the half-sarcomere length at which activation started, lhs[0], and the active stretch increment, Δlhs.
The thick black curve at the right edge of the surface corresponds to the static total stress—stretch relation shown in Fig 8 (top).

