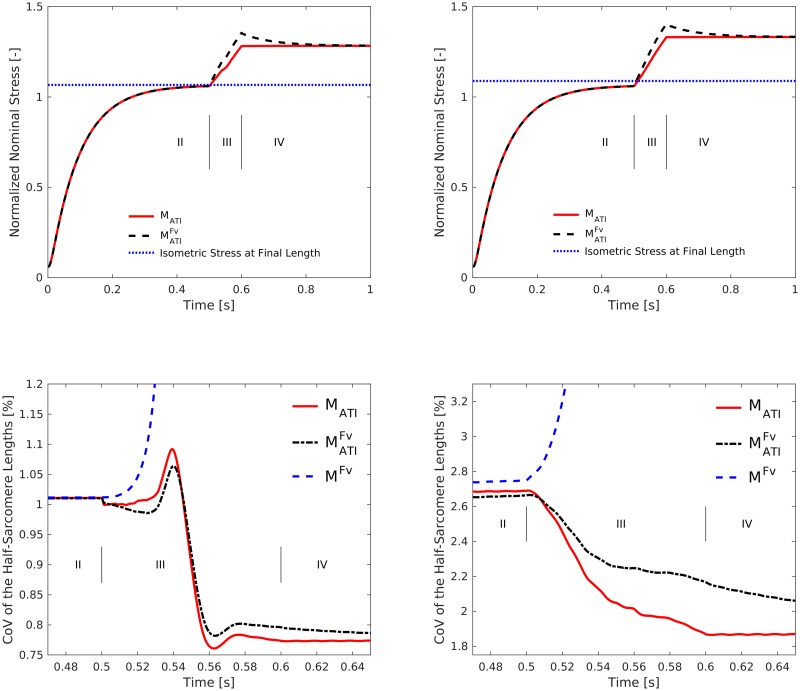
Fig 10. Active stretch experiments.
Initial half-sarcomere length inhomogeneity is introduced via variation of passive (left column) and active (right column) material properties (see text). Top: Total stress evolution in models (black dashed line) and MATI (red line) following a protocol of passive stretch from L/L0 = 1.0 to 1.05 (phase I, i.e., computing the passive stretch as shown in Fig 6), full activation at fixed length (phase II), active stretch at a velocity of v/vmax = 13.3% from L/L0 = 1.05 to 1.25 (phase III), and subsequent fixed-length contraction (phase IV). Additionally, the stress resulting from a fixed-length contraction (model ) at the same final length L/L0 = 1.25 is shown (blue dotted line). The kink in the red line during the active stretch marks the transition from the plateau to the descending limb of the force—length relation. Note that we excluded stresses from models MFv and from these figures, since these models cannot reproduce the expected forces on the descending limb (previously shown, see e. g. Fig 6). Bottom: Coefficient of variation (CoV, standard deviation/mean*100%) of the half-sarcomere lengths corresponding to the above stretch experiments.

