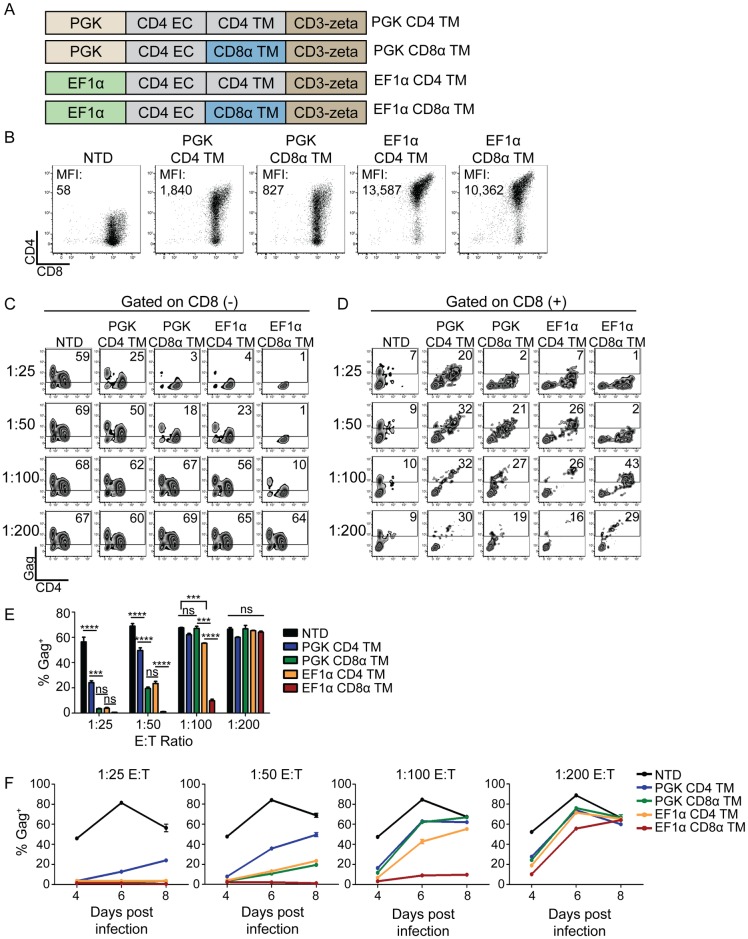
Fig 2. EF1α promoter and CD8α transmembrane domains improve CAR expression and control over HIV.
(A) Schematic of the constructs compared in this figure. (B) CD4 CAR expression 8 days after activation. Median fluorescence intensity (MFI) is indicated on each graph. (C) Intracellular Gag staining on day 7 of co-culture, for CD8 negative T cells and (D) for CD8 positive T cells. (E) Summary data for a single experiment, performed in triplicate, gating on the CD8 negative cells. Error bars indicate SEM. Significance was detected using a 1-way ANOVA test, stratifying based on the E:T ratio (p values: ns >0.05, *<0.05, **<0.01, ***<0.0001). This data is representative of three independent experiments. S15 Fig shows each of the 3 independent experiments. (F) The levels of intracellular Gag in CD8 negative T cells over the time course of an experiment. Each graph represents a different E:T ratio. Error bars indicate SEM (n = 3).

