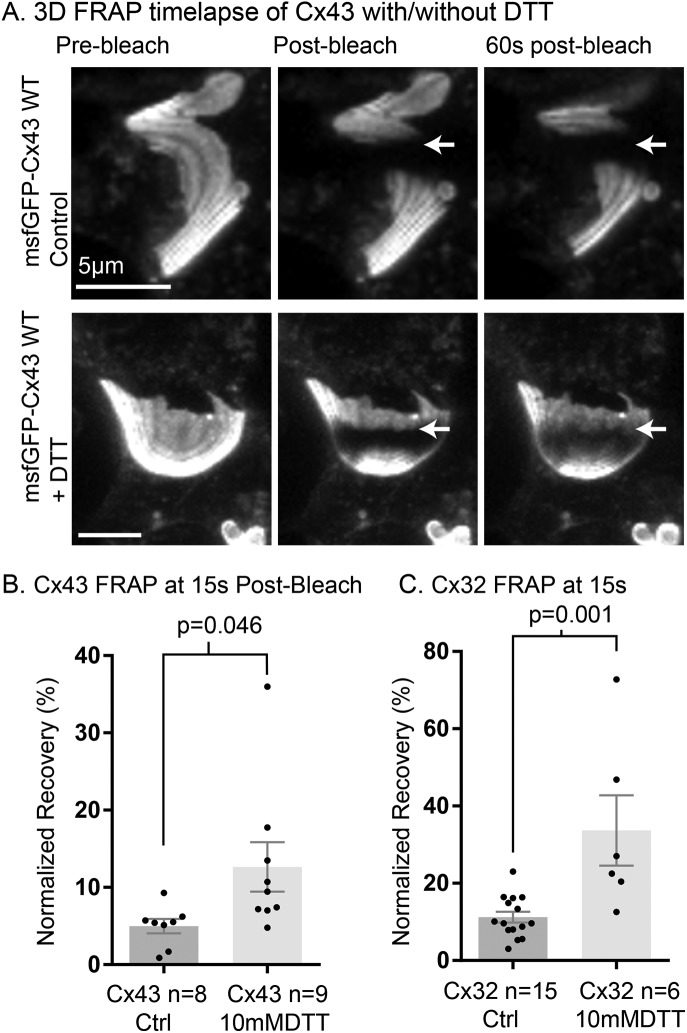
FIGURE 4:
Cellular redox balance controls channel arrangement within GJ plaques. (A) Three-dimensional time-lapse FRAP images of HeLa cells expressing msfGFP-Cx43 (untreated controls, top row), and three-dimensional time-lapse FRAP images of HeLa cells expressing msfGFP-Cx43, treated with 10 mM DTT for 6 h (bottom row). The location of the border of the bleached region of the plaques is indicated by arrows. (B) Percentage recovery of normalized fluorescence into the bleach region at 15 s for msfGFP-Cx43 in HeLa cells using two-dimensional time-lapse FRAP with and without 6-h treatment with 10 mM DTT. (C) Percentage recovery of normalized fluorescence into the bleach region at 15s for msfGFP-Cx32 with and without 6-h treatment with 10 mM DTT. Data for Cx43 and Cx32 are compared separately because there was a significant difference between sfGFP-Cx43 and sfGFP-Cx32 GJ length (Cx32 17.68 ± 2.926 µm vs. Cx43 11.85 ± 0.9938 µm, p = 0.0375). Data for untreated controls are sourced from previous figures of this report. Groups in B and C compared by Student’s t test (two-tailed).

