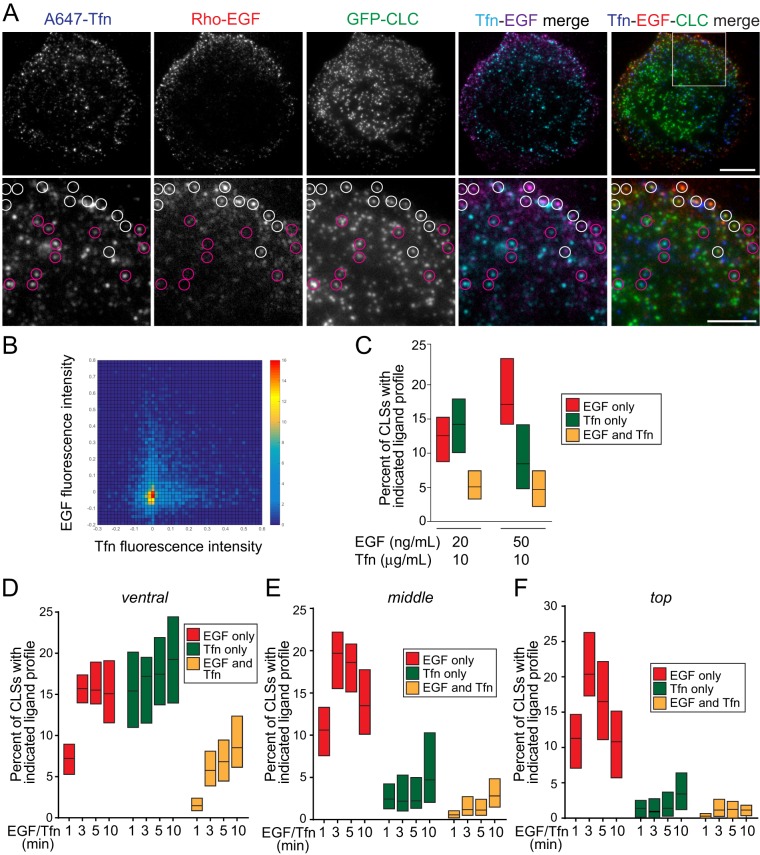
FIGURE 5:
EGF and Tfn are recruited to largely distinct CLSs. RPE cells stably expressing clathrin light chain fused to eGFP (eGFP-CLCa) were treated with 20 ng/ml rhodamine-EGF (rho-EGF) and 10 μg/ml A647-Tfn for 5 min or the indicated time, followed by immediate fixation. (A) Shown are representative micrographs obtained by TIRF-M. Scale bars: 10 μm (top row); 5 μm (bottom row, corresponding to enlarged images of the region shown in the merged image of the top row). White circles depict CLSs that are positive for EGF but devoid of Tfn, and purple circles depict CLSs that are positive for Tfn but not EGF. (B, C) CLSs were subjected to automated detection and analysis as described in Materials and Methods. Shown in B is a two-dimensional histogram of the normalized EGF and Tfn fluorescence intensities in each CLS cohort. Shown in C are median (bar) and 25th/75th percentiles (boxes) of the proportions of CLSs that are positive for EGF (but not Tfn), Tfn (but not EGF), or both EGF and Tfn. The number of CLSs and cells analyzed, respectively, for each condition are as follows: 10 ng/ml rhodamine-EGF and 10 μg/ml A647-Tfn: 70,124 and 57; and 10 ng/ml rhodamine-EGF and 10 μg/ml A647-Tfn: 46,240 and 37; from a minimum of three independent experiments in each condition. (D–F) Images obtained by spinning-disk confocal microscopy, corresponding to ventral, middle, and top z-sections of cells (see Supplemental Figure 5 for representative images) were subjected to automated detection and analysis as described in Materials and Methods. Shown are median (bar) and 25th/75th percentiles (boxes) of the proportions of CLSs in the ventral (D), middle (E), and top (F) z-sections that are positive for EGF (but not Tfn), Tfn (but not EGF), or both EGF and Tfn. The number of CLSs analyzed and cells for each condition (from three independent experiments) are provided in the legend for Supplemental Figure 5.

