FIGURE 6:
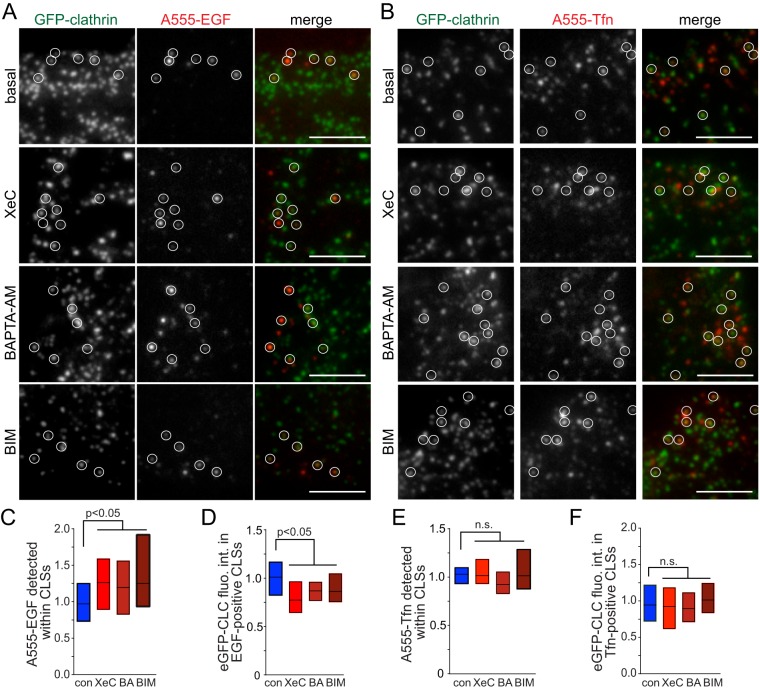
Cytosolic Ca2+ and PKC regulate CLSs containing EGFR but not those harboring TfR. RPE cells stably expressing clathrin light chain fused to eGFP (eGFP-CLCa), treated with various inhibitors as in Figures 3 and 4: 3 μM XeC for 30 min, 10 μM BAPTA-AM (BA) for 15 min, 1 μM BIM for 30 min, or left untreated (control), and then treated with A555-EGF (A) or A555-Tfn (B) for 5 min. Shown are representative micrographs obtained by TIRF-M. Scale bar: 5 μm. Full image panels are shown in Supplemental Figure 7. (C–F) TIRF-M images were subjected to automated detection of CLSs, followed by quantification of mean A555-conjugated ligand fluorescence intensity therein (C, E). CLSs were sorted into A555-EGF-enriched or A555-Tfn-enriched cohorts, followed by quantification of the mean eGFP-CLC within each CLS cohort (D, F). For C–F, the overall median of the cellular means (bar) and 25th/75th percentiles (boxes) are shown. The number of CLSs and cells analyzed, respectively, for each condition are as follows: EGF control: 14,114 and 114; EGF XeC: 11,322 and 98; EGF BAPTA-AM: 15,786 and 104; EGF BIM: 3860 and 46, Tfn control: 16,983 and 117; Tfn XeC: 10,838 and 98; Tfn BAPTA-AM: 8868 and 64; Tfn BIM: 3718 and 44; from a minimum of three independent experiments in each condition.

