FIGURE 7:
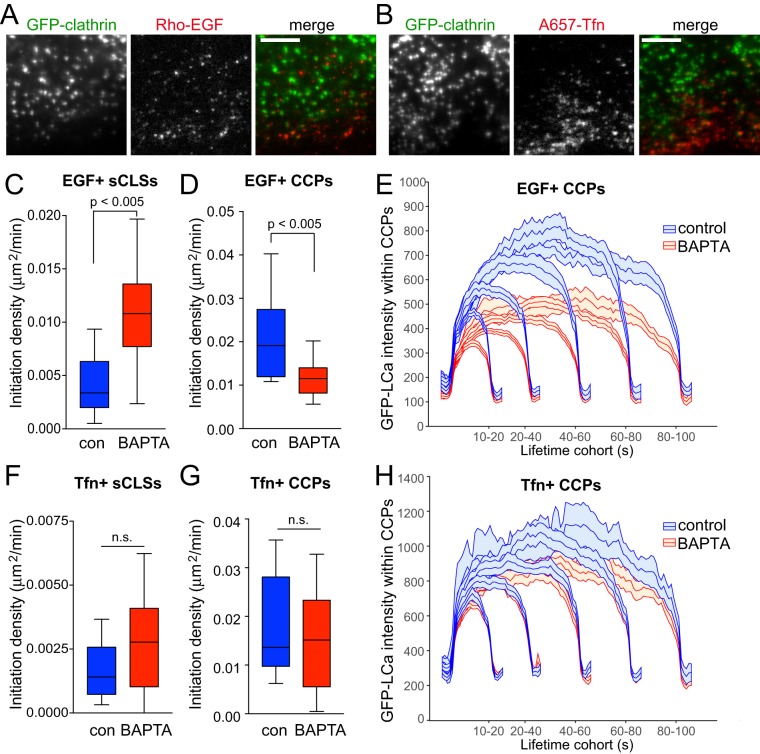
Cytosolic Ca2+ selectively controls initiation and assembly of CCPs harboring EGFR. RPE cells stably expressing clathrin light chain fused to eGFP (eGFP-CLCa) were pretreated with 10 μM BAPTA-AM for 15 min, and then treated with either 20 ng/ml rhodamine-EGF (Rho-EGF) or treated with A647-Tfn during time-lapse imaging by TIRF-M. (A, B) Single-frame representative fluorescence micrographs. Scale bar: 5 μm. Time-lapse TIRF-M image series of cells treated with Rho-EGF (C–E) or A647-Tfn (F–H) were subjected to automated detection, tracking, and analysis of CLSs as described in Materials and Methods, allowing identification of sCLSs and bona fide CCPs as EGF+ or Tfn+, as appropriate. (C–D, F–G) Median, 25th/75th percentiles (boxes) and Tukey range (whiskers) for the initiation rate of ligand-positive sCLSs (C, F) or ligand-positive CCPs (D, G) are shown. (E, H) Mean eGFP-CLCa fluorescence intensity grouped into CCP lifetime cohorts; error bars reflect cell-to-cell variation. The number of total CLS trajectories, CCP trajectories, and cells for each condition are (respectively): rho-EGF treated (control, DMSO): 24,737, 16,621, and 18; rho-EGF treated (BAPTA-AM treated): 33,604, 14,731, and 24; A647-Tfn (control, DMSO) 32,693, 22,008, and 24; A647-Tfn (BAPTA-AM) 35,287, 20,862, and 25. The breakdown of ligand-positive sCLSs and CCPs is as follows: 5.0 ± 0.7% (control) and 8.5 ± 0.5% (BAPTA-treated) of sCLSs are EGF+; 13.2 ± 0.9% (control) and 10.9 ± 0.9% (BAPTA-treated) of CCPs are EGF+; 3.1 ± 0.4% (control) and 4.0 ± 0.7% (BAPTA-treated) of sCLSs are Tfn+; 13.6 ± 1.9% (control) and 13.2 ± 1.9% (BAPTA-AM) of CCPs are Tfn+.

