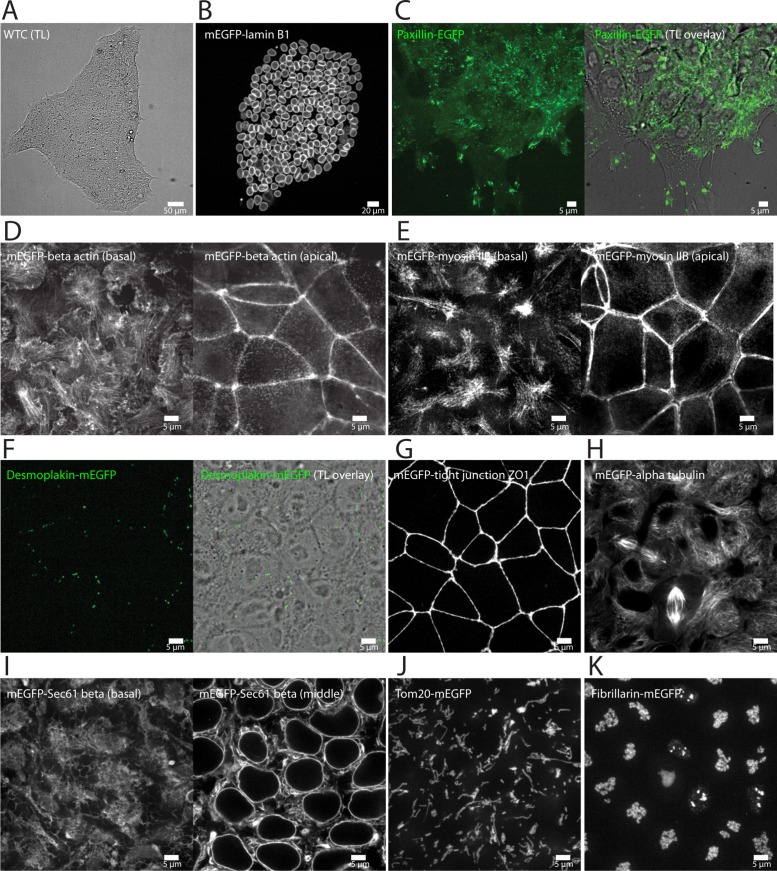
FIGURE 3:
Live-cell imaging of final 10 edited clonal lines. Additional images and movies, displaying additional biological features of each cell line, can be found at the Allen Cell Explorer (Allen Institute for Cell Science, 2017). All images are single images taken from a z-stack unless otherwise noted. (A) WTC hiPSC stem cell colony (transmitted light image; TL) depicting normal morphology when cells were plated on Matrigel-coated glass. (B) mEGFP-tagged nuclear lamin B1 localized to the nuclear envelope (nuclear periphery) in nondividing cells and to an extended nuclear lamina within the cytoplasm during mitosis. Image is a maximum-intensity projection of the entire colony. (C) EGFP-tagged paxillin localized to puncta at the bottom surface of the cell and larger patches near the dynamic edges of the cell colony, consistent with the localization to matrix adhesions. Some diffuse signal throughout the cytosol was also observed. Images are from the bottoms of the cells. Right, fluorescence channel overlaid onto the TL channel to indicate colony edges. (D) mEGFP-tagged beta actin localized to stress fibers and lamellipodia at the bottom of the cells (left), to a junctional band at the top of cells (right), and to regions of cell–cell contact in the center of cells (unpublished data). Some diffuse signal throughout the cytosol is consistent with depolymerized actin. (E) mEGFP-tagged nonmuscle myosin heavy chain IIB localized basolaterally to stress fibers (left), to an apical actin band (right), and to regions of cell–cell contact in the centers of cells (unpublished data). (F) mEGFP-tagged desmoplakin localized to puncta at apical cell–cell boundaries, consistent with desmosomes. Puncta are not visible in all cells; however, when present, there were varying numbers per cell (left, a maximum-intensity projection of the upper half of the volume of the cells; right, fluorescence channel overlaid onto the TL channel to indicate cell–cell boundaries). (G) mEGFP-tagged tight junction protein ZO1 localized to an apical tight junction band. Weak signal is detectable at cell–cell boundaries in the apicobasal middle of cells (unpublished data). Image is a maximum-intensity projection. (H) mEGFP-tagged alpha tubulin localized to microtubules, mitotic spindles, primary cilia, and midbodies; some diffuse signal was also observed throughout the cytosol, consistent with depolymerized tubulin. (I) mEGFP-tagged Sec61 beta was detected in ER sheets and ER tubules throughout the cytoplasm (right, image from near the middles of the cells) and in the nuclear periphery (left, image from near the bottoms of the cells). (J) mEGFP-tagged Tom20 localized to mitochondrial networks throughout the cytoplasm. Image is a maximum-intensity projection of 5 z-slices near the bottom of the cells. (K) mEGFP-tagged fibrillarin was observed in intranuclear structures. Image is a maximum-intensity projection. (A–K) Scale bars in all panels are as indicated. All imaging was performed in 3D on live cells using spinning-disk confocal microscopy with a 100× objective, except A and B, which were obtained with a 10× objective. (B–K) Representative images of final gene-edited cell lines.

