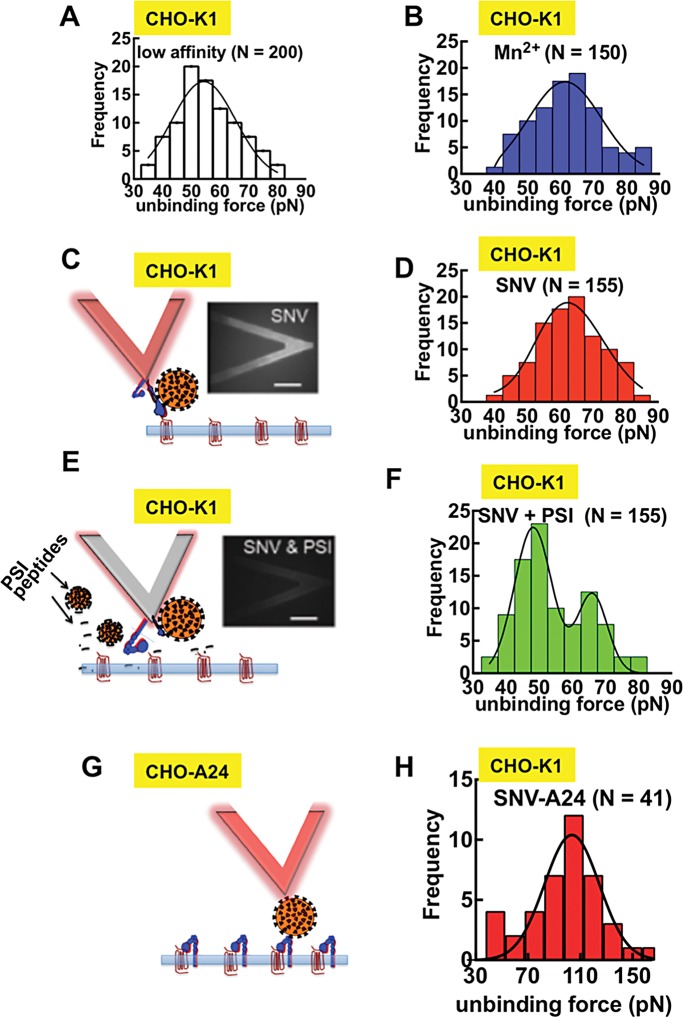
FIGURE 7:
Binding of SNV to integrin PSI induces integrin activation. (A) Force histogram of low affinity αIIbβ3-RGDP2Y2R interactions; (the loading rate, rf, was 720 pN/s; N refers to the total number of adhesion events for all histograms). (B) Force histogram of αIIbβ3-RGDP2Y2R interactions in the presence of 2 mM Mn2+ (rf = 700 pN/s). (C) Fluorescence micrographs (bottom view) of an integrin-functionalized cantilever preincubated with fluorescently labeled SNVR18. (D) Force histogram of αIIbβ3-RGDP2Y2R interactions with SNV bound to the integrin PSI domain (rf = 739 pN/s). (E) Fluorescence micrographs (bottom view) of an integrin-functionalized cantilever preincubated with fluorescently labeled SNVR18 and PSI domain polypeptide for blocking SNV binding. (F) Force histogram of integrin after probe was exposed to SNVR18 and PSI domain peptide. (G) SNV functionalized cantilever. (H) Force histogram of SNV–αIIbβ3 interactions in CHO-A24 cells.

