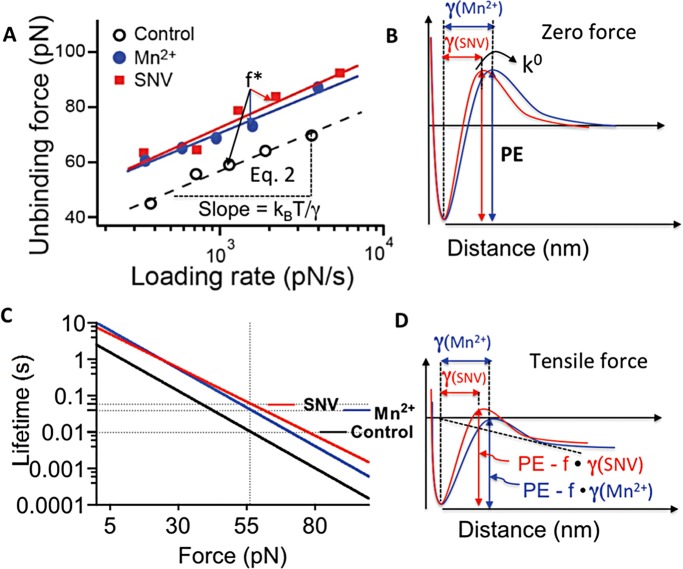
FIGURE 8:
Analysis of potential barrier energy landscapes and bond lifetimes by dynamic force spectroscopy (A) Dynamic force spectrum: Plot of most probable unbinding force (f* in Eq. 2) of αIIBβ3–integrin/RGD interactions vs. logarithm of loading rate, experimental data are shown as follows: red square (SNV activated integrin), blue circle (Mn2+-activated integrin), and open circle (low affinity integrin). Lines represent fits to Eq. 2. γ, the distance of the potential barrier position from the bottom of the potential well, is derived from the slope. The force-free dissociation rate, k0, is derived from the intercept of the fit. (B) Potential energy landscape of the αIIBβ3–RGDP2Y2R bond qualitatively showing the relative magnitudes of energy barrier widths of SNV (0.35 nm) and Mn2+- (0.40 nm) activated interactions derived from the DFS. k0 values for SNV and Mn2+-associated interactions were 0.13 s–1 and 0.097 s–1, respectively. (C) Effect of tensile force (f in Eq. 1) on the lifetime of the αIIBβ3-RGDP2Y2R interactions, for control and SNV- and Mn2+-treated samples. (D) Effect of tensile force on the potential energy barrier landscape of SNV- and Mn2+-treated integrin–RGDP2Y2R interactions (see the text for details). The mechanical energy for each applied force lowers the transition state energy barrier by -f•γ as shown.

