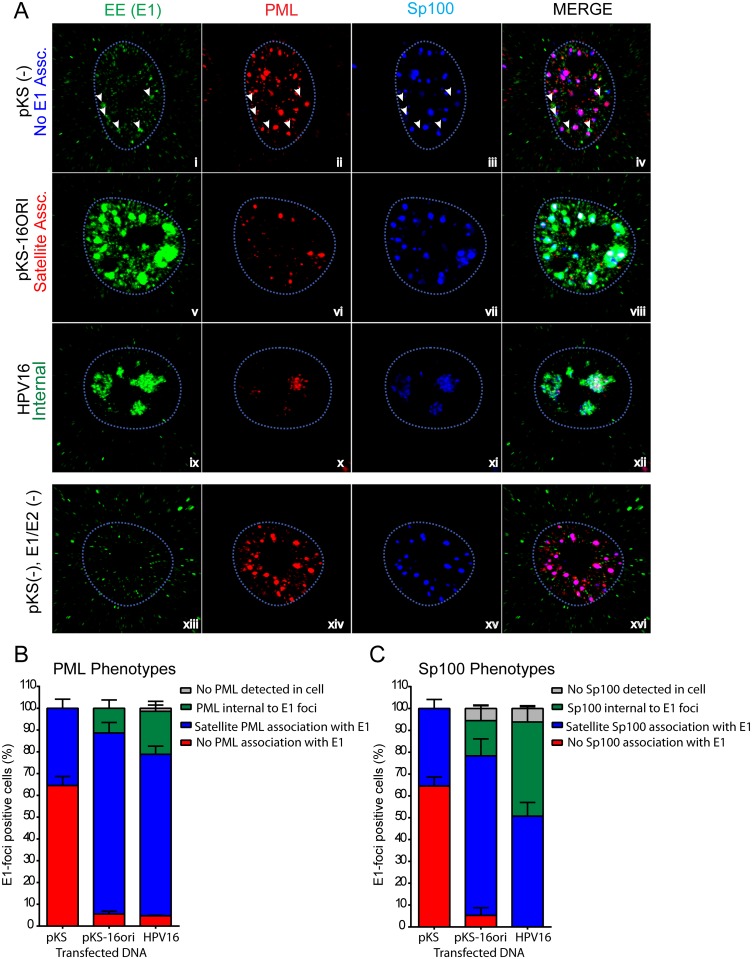
Fig 2. PML and Sp100 associate with HPV replication factories.
A. Using the same data as Fig 1, cells were assessed for the predominant phenotypes observed for PML and Sp100 association with replication foci. Images are single optical slices collected by confocal microscopy and representative of three independent transfections. The tip of each arrow in panels i-iv indicates the location of E1/E2 foci. B and C. E1-foci positive cells were scored for four different PML (C) or Sp100 (D) phenotypes: No PML/Sp100 (grey), No E1 association (blue), satellite association (red) or internal to replication foci (green). Graph comprised of data from a minimum of 20 cells from three independent experiments (Total N = 60). Error bars represent +/-SEM.

