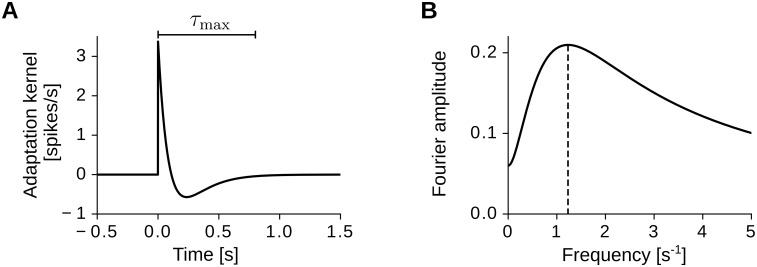
Fig 1. The temporal adaptation kernel K.
(A) Impulse response of the filter (Eq 2). A positive peak with amplitude K(0) = 1/τS − μ/τL ≈ 3.4 spikes/s is followed by a slow negative response. Note that the kernel is small for t > τmax, i.e., |K(t)| < 0.01|K(0)| for t > τmax, with τmax = 5τL = 0.8 s. (B) Frequency response of the filter. The dashed vertical line indicates the filter’s resonance frequency kres = 1.23 s−1. Parameter values: τS = 0.1 s, τL = 0.16 s, μ = 1.06. The integral of the filter is 1 − μ = −0.06.

